Quantcast
Channel: Analytics India Magazine
Viewing all 17771 articles
Browse latest View live

Great Lakes Institute of Management participates in CYPHER2015

$
0
0

Great Lakes Institute of Management is one of the leading business schools in the country providing quality analytics education. Great Lakes’ Post Graduate Program in Business Analytics is ranked amongst the top 3 analytic programs and is a 12 months blended (classroom + online) program designed for working professionals. The program is now offered in Bangalore, Chennai and Gurgaon. Recently, Great Lakes’ participated in India’s most promising analytics summit.

Cypher 2015, which was scheduled on 12th Sep 2015, saw more than 400 attendees from 150+ organizations saw more than 30 thoughts leaders from Indian analytics industry. Great Lakes exhibited at the summit showcasing the various features of their analytics program. Both the program directors – Dr. Bappaditya Mukhopadhyay and Dr. Vishwanathan P K spoke at the summit.

Dr. Bappaditya Mukhopadhyay took a workshop on “Formulating a Problem: The Art & Science of Data Gathering”. Problems come as unstructured as possible. Analytics begins with defining the problem adequately, identifying the data source and often creating the data. In this workshop, Prof Bappa explored the art of problem formulation and the science of data gathering. It was a highly received workshop with highly enthusiastic audience asking numerous questions to Prof Bappa.

Great Lakes have recently launched their analytics program in Bangalore, after Chennai and Gurgaon. Speaking about this, Prof Bappa detailed “Looking in terms of which city to go after Chennai and Gurgaon, Bangalore is a natural progression with various analytics organizations. Many of these organizations would like to either acquire fresh talent or reskill their existing analytics talent.”

When asked about his take on Cypher2015, Prof Bappaditya spoke; “It’s Fantastic! You meet so many people who are industry experts and its even more heartening to see lot many people who are not formally trained in analytics but they are here because they want to know more about it and are willing to invest their time and resource on it.”

Dr Vishwanathan P K chaired the panel discussion on Analytics Education in India. The other speakers for this panel were Dr Anshuman Gupta; Head (Decision Science Program), Cognizant Analytics at Cognizant Technology Solutions, Dr Prithwis Mukerjee; Program Director, Business Analytics at Praxis Business School, Vikas Gupta; Managing Director at Wiley India and Ankit Gupta; Business Head – E-commerce at TPG Wholesale Pvt. Ltd.

The panel discussion focussed on the state of Analytics Education in India, the industry expectations, how to create an excellent industry ready quality professional workbench and what next in this journey.

Prof Vishwanathan shared his views about Analytics Education in India, “The future certainly belongs to business analytics, which will replace traditional ways of doing business. Business Analytics courses offered by premier institutions can facilitate corporates to become winners in the marketplace.   Analytics Education in India should provide comprehensive knowledge of analytic techniques with an applied orientation for executives working in business analytics as well as professionals interested in a career in analytics.”

More information on Great Lakes Business Analytics Program can be accessed at http://elearning.greatlakes.edu.in/pgpba/

(Visited 59 times, 7 visits today)

The post Great Lakes Institute of Management participates in CYPHER2015 appeared first on Analytics India Magazine.


Analytics usage in emerging markets

$
0
0

SGanesh

In the last two decades, investments made in digitalization and transaction automation have enabled organizations to evolve significantly in their ability to capture raw customer behaviour data. This combined with massive increase in computing power and data storage has fuelled the growth of analytics industry, now worth more than $50 billion globally.

However, we find that the adoption of analytics is less significant in emerging markets of South Asia, Middle East and Africa compared to the more mature markets of North America and Western Europe. This article presents some key findings of a survey done by dun & bradstreet to assess the adoption of analytics in emerging markets and the emerging trends.

Dun & Bradstreet Survey

Dun & Bradstreet had carried out a survey to assess the usage of analytics in the banking industry as banks have traditionally been the biggest user of analytics. The survey team contacted business and technology decision makers across 250 banks and received 119 responses. Given below are some of the key findings:

SGanesh1Adoption of predictive analytics is low

Only one third of the banks confirmed using predictive analytics in their organization. Even among the large banks (> $ 5 billion assets), the adoption rate is less than 50%. In absence of analytical models, most of the banks use well-defined business rules for making lending decisions. Also, this is main form of decision in Islamic banking compared to traditional banking.

SGanesh2Analytics usage is limited to very few areas

Banks are using analytics in very limited areas with main focus on meeting regulatory requirement and risk management. The use of analytics for the purpose of marketing, pricing, customer loyalty and profitability management is very minimal and practiced by few very large banks only. Investments in social media and web analytics are at a very nascent stage.

SGanesh3Reasons for Low Adoption

Nearly half of the banks not using analytics cited “insufficient data” as the primary reason. This is largely due to lack of maturity in IT systems to store historical information in digital format, while one third of the banks are satisfied with current process of relying on business rules instead of analytics. However, most of the banks believe that the adoption will increase in next 2 years with recent investments in transaction automation and data warehousing solutions.

SGanesh3Analytics journey has just begun in these markets

More than 80% of the banks using predictive analytical models in their business decision making process reported that these models were developed within last two years. The main drivers for analytics were stricter compliance requirement from central banks, growing uncertainty in financial markets and need for deploying capital more efficiently. However, banks reported that analytics has also helped them in improving speed and accuracy in their lending decisions.

SGanesh3Reliance on third party service providers

Majority of banks have partnered with third party service providers for development of analytics solutions instead of building in-house analytics teams. The key reasons are readily available analytics talent, existing infrastructure of service providers and their experience in developing similar solutions for other markets. However, the large banks have either already invested or plan to invest in building in house analytics infrastructure and capability.

Does it pay to invest in analytics?

As part of this study, dun & bradstreet also cSGanesh3ompared the performance of analytical models with commonly used business rules in taking credit decisions. It was found that analytical models outperformed the best business rules by 24% in their ability to predict credit worthiness of a new customer. In a specific case study, the analytical models delivered an increase of 8% in approval rates with a decline of 1.1% in customer delinquencies adding around $ 10 million on a portfolio of $ 1 billion.

Summing Up

It is evident that currently the adoption of analytics, both in terms of width and depth is fairly limited in the emerging markets compared to the mature markets. Availability of sufficient data of acceptable quality and appetite for investments in analytics infrastructure have been the traditional hurdles. However the investments made in core transactional systems and customer management channels are producing a lot of data about customer behaviour and preferences, which can be leveraged by organizations to understand consumer needs and customize their product and service offerings accordingly to enhance customer experience and loyalty, while mitigating risk. Substantial reduction in data storage costs and analytics tool and technologies has also made development and implementation of analytics solutions more affordable.

Though we still witness some reluctance in using analytics instead of business rules or manual judgement in customer decisions, especially in the higher levels of management. This may be because a generation ago most organizations lived in a data starved environment which resulted in most successful managers of the time relying on experience and intuition to take decisions. We believe that this is likely to change as they start realizing the benefits on their initial investment in analytics to justify higher investments for greater adoption. The use of analytics in emerging market has just begun and we see tremendous growth opportunities in these markets.

(Visited 20 times, 20 visits today)

The post Analytics usage in emerging markets appeared first on Analytics India Magazine.

Using Big Data in Military Operations: This is how future wars will be fought

$
0
0

Big Data has no other better explanation than the fact that it is “BIG”!! Big enough data to fill twice the height of all CDs stacked over one another till moon. In technical terms, anything that is generating billions of data from online, offline systems and applications like text, video, speech etc. can be classified under big data. Big Data Analytics is analysing these data to find patterns, correlations, trends that can be used to drive decisions. As we move deeper from mere information age to rapidly evolving digital information age, many decisions taken by public and private corporations is through data. Data has thus, increasingly become ubiquitous everywhere.

As we find ourselves being swamped by data and realize that it is being put to use in almost every aspect of our lives, right from what we want to buy next, to how much we should sleep tomorrow (coming soon!), there is another very important use, that a very different community has found for big data, the Military Community. In the advent of digital age, wars are becoming increasingly asymmetric in nature between countries or groups that have disproportionate military assets and capabilities. The War on Terror fought between terror groups and International Security Assistance Force (consisting of US and its Allies) has taken the dimension to a whole new level. Unmanned Aerial Drones have taken precedence over soldiers, wherein after receiving crucial inputs regarding terrorist hideouts (in remote mountainous terrain), they strike with deadly precision. Missiles receive real time data based on which their flight paths can be adapted to hit critical moving targets.

MQ-9 Reaper
MQ-9 Reaper

So where is big data involved in this? Google processes around 22 Petabytes a day. Every day, around 204 million e-mails, 1.8 million Facebook likes, 278000 tweets are being generated[1]. It is naturally obvious that even terrorists or a member of an enemy country holding a critical position is doing the same. But apart from it, a very large number of data is also being generated by a large number of military operations. A single MQ-9 Reaper drone, used for spying mission, collects “the equivalent of 20 laptops” worth of data[2]. Reapers and Predators also have 12 cameras which are attached to them to record video every second, a vision also called as the “Gorgon Stare”[3]. The US ARGUS ground surveillance system collects more than 40 Gigabytes of information per second[2]. Spy satellites deployed by countries like US also generate gigabytes of geospatial data. It has become increasingly important for military officials to make sense of the vast amount of data that they are producing.

This is where big data analytics comes into the picture. Information gathered through internet platforms and through standard military operations can be put to varied use. Modus Operandi, an analytics company has created an application called Wave Exploitation network, which makes use of big data analytics to give frontline troops information about how people, places, organisations and events are connected over time[4]. The application also allows to make use of semantic technology to explore data. The US Army Force Management Enterprise Division uses big data and predictive analytics through a system called as Enterprise Management Decision Support tool (EMDS), which drives enterprise related operations across all US Army departments and answers queries regarding any data that an analyst can ask about right from the enemy operations in Afghanistan to personnel payment details at Army Headquarters[5].

Most of the data can be derived from Hadoop applications like HBase, Accumulo and ClouldBase. Human and Speech Recognition is being done with the help of various Natural Language Processing Systems[5]. The data sources include a range of inputs from social media, news accounts, field reports, right to bank transactions from e-commerce sites or through mobile. Leading players apart from niche players like Modus Operandi, are IBM, which has applications related to Military Intelligence. SAS provides software related to Military Personnel Planning.

military big dataHow does this ultimately help? Frontline troops deployed in critical areas can receive quick and timely information about targets allowing them to deploy minimum necessary force to neutralize it, aerial drones can target militants without inflicting civilian causalities, Missiles can be made real time smart(that which knows when and where to hit the enemy), Intelligence officials can thwart terror attacks based on advance information, cyber-attacks from other countries (especially Chinese attacks on Indian military networks) can be prevented by analysing the modus operandi of enemy, terror promotion campaigns by organisations like the ISIS can be countered online. Also, by doing an enterprise level management of data, militaries can process information about its people, equipment, training, installations, and force readiness thereby improving the overall efficiency and effectiveness. Ultimately, this enables the military to SAVE LIVES, of its soldiers, and its people.

But all the above mentioned uses is not void of challenges. The amount of data is huge and the systems used are sophisticated, this requires an increasing need for competent and skilled personnel who can crunch huge data and solve problems, a segment that currently is short of such types. Training the existing workforce is also a challenge. Developing Models especially for military operations have to be constantly refined and enabled with even more sophisticated security protocols (to prevent lapse of data). Some of the military commanders are still comfortable with conventional old school military tactics and may not immediately take technology’s assistance on its face value.

Despite the fact that there are obstacles, today’s militaries are increasingly filled with young tech savvy personnel who are ready to take on new challenges through technology. There is a great opportunity for public-private partnership in this sector especially when technology majors (IBM, SAS) are coming to the fore. Armed forces of India and China have realized the need for such technology and are quickly adopting the trend of developed nation’s armies. Overall, there is a great positivity involved, but the extent of implementation and evolution in this sector needs to be seen. We consider it very important as wars will still have the power to define the future of nations. But, fortunately, we all know that we have BIG DATA and now it is helping our soldiers’ guard us better so that we can continue to sleep in peace.

Authors

Abhijeet Gaurav1Barathram R

An avid marketer, currently pursuing 2nd Year PGDM at IMT Ghaziabad who is passionate about Military History and Geo-Politics in Asian sub-continent. He also closely follow latest trends in technology, particularly Internet of Things. He can be found on LinkedIn at goo.gl/izmit6.

Abhijeet Gaurav1Abhijeet Gaurav

Abhijeet is a 2nd year student of PGDM at IMT, Ghaziabad. He has a keen interest in the field of Marketing and Information Technology. He enjoys driving, travelling, researching and casual reading. He can be found on LinkedIn at http://goo.gl/qNKl0o and followed on Twitter at @Abhijeet1407.

(Visited 119 times, 119 visits today)

The post Using Big Data in Military Operations: This is how future wars will be fought appeared first on Analytics India Magazine.

Crime Analytics

$
0
0

Increasing crime rates play a crucial role in hindering the growth of a nation as a unit, especially in the case of developing countries like India. This particular development in the crime behavior always has a greater impact on foreign investments as well as international image of the country in the global environment. There is a strong need to monitor and analyze the crimes occurring across the country in addition to regulating them. Though the task of crime regulation is solely under the hands of the government, analysis of the crimes should be carried out in order to derive conclusions and suggest necessary actions and measures extracted from analytical analysis of the past crime database. This method can play a significant role in helping the government in taking better actions for maintaining law and order in the nation and also effectively utilizing their valuable resources.

Crime analytics can be viewed as branch of analytics that deals with methods and applications of statistical tools and techniques to analyze the crime data that will help the police to resolve the crimes at faster rate and get easy insights from the data. It includes the analysis of crimes and criminals, crime victims, disorder, quality of life issues, traffic issues, and internal police operations. And output of crime analysis can be used for criminal investigation and prosecution, patrol activities, crime prevention and reduction strategies, problem solving, and the evaluation of police efforts. Rising crime rate across the globe, increase in different types of crimes and increase in pressure to reduce law enforcement officer have made crime analytics very essential in today’s world.

Thanks to the technological advancements over the past decade, we are able to generate and store terabytes of digital information in the form of emails, videos, chat files, text files, CCTV files, GPS information, etc. and effective analysis of these data can provide evidence central to solving crime and achieving prosecutions. Expecting law enforcing agencies or officials to understand different type of data formats and dig through this volume of data and with less time with insights needed for them is close to impossible. A right tool is very critical to unearth truth or view the required insights from this mountain of data

The International Association of Crime Analysts (IACA) recognizes four categories of crime analysis, ordered from specific to general:

1) Crime intelligence analysis

2) Tactical crime analysis

3) Strategic crime analysis

4) Administrative crime analysis

Crime Intelligence analysis – Crime intelligence analysis is the analysis of data about people involved in crimes, particularly repeat offenders, repeat victims, and criminal organizations and networks.

Tactical Crime Analysis – Tactical crime analysis is the analysis of police data directed towards the short-term development of patrol and investigative priorities and deployment of resources.

Strategic Crime Analysis – Strategic crime analysis is the analysis of data directed towards development and evaluation of long-term strategies, policies, and prevention techniques.

Administrative Crime Analysis – Administrative crime analysis is analysis directed towards the administrative needs of the police agency, its government, and its community.

In India the application of crime analytics is fairly less when compared to western countries. The Chicago Police Department, for instance, has applied a predictive computing model to generate a ‘heat list’ of approximately 400 people most likely to be involved in crime, as victims or offenders. Elsewhere, in San Mateo County, California, police are putting their data to work to predict potential crime scenes. In the city of Memphis only, serious crimes fell to 30 percent and while other violent crimes went down to 15 percent after implementing predictive analytics. In the same lines you can see crime analytics getting implemented at European countries as well.

In India, National Crime Records Bureau (NCRB) is a separate agency which collects crime related data for the last 28 years. It functions as clearing house information on crime and criminals including those operating at National and International levels. NCRB is now using GIS based analytics services to predict and curb the crime rates. It has its very own fingerprints, sketch and all other sort of database.

Key Phases of Crime Analytics

Analytics that runs on the crime data can be viewed under three different phases:

  • Pre Crime Analysis
  1. Predictive analytics to identify the location where next crime might happen (burglaries and auto theft tend to be clustered in terms of time and location and the individuals committing these crimes tend to have predictable patterns)
  2. Analyzing social media data to identify hot zones where riot / assault might happen
  3. Preparing a “heat list” of top offenders and probable victims or probable areas can help law enforcement agency plan their monitoring routines or activities
  4. Aggregated human behavioral data captured from the mobile network infrastructure, in combination with basic demographic information, can be used to predict crime
  5. Analytics software can predict if a prisoner is granted parole will he commit any crime or violate parole conditions
  • Run Time Analysis:

This is dynamic and current data analytics and it changing analytics with respect to time. Statistical analysis can be run on every data soon after its completions to arrive at certain numbers like Crime Index. This analysis will helps to get an overview of safety and prevailing conditions as on date.

  1. Creating an Area Crime index using various risk factors (bars, clubs, liquor stores, etc.)
  2. Social media feeds can be used to identify if any agitation is happening or is going to happen in any particular area
  • Post Crime Analysis:
  1. Analyzing trends and patterns for various type of crime in different area to provide support accordingly
  2. Leads identification after analyzing offenders and modus operandi information.
  3. Identifying links between suspects, and their involvement in crimes and criminal activity.

How to predict crime rates

Here the prediction of crime trend is classified into three groups namely,:

  1. Prediction of crime trends according to the different types of crimes such as robbery, dacoity, assault of women, child trafficking etc.
  2. Prediction of crime trends for the different clusters made according to the different parameters available in the data, such as amount of loss of property, number of lives lost in the crime, number of criminals involved in the crime.
  3. Prediction of overall crime trends for any particular area.

Conclusion

New developments in science and technology will help the human race to make their lives simple and happy and on the other hand created lot of new methods of doing different illegal activities. It becomes a huge challenge for any policing organization to effectively control and resolves the crimes that are happening around. Crime analysis is not only bounded in theory, it has many aspects to help security department of any country to take right actions before the crime happens. The current study focused on how the data enabled decisions really makes a different than a traditional approach of solving the crimes.

The analysis helps in three different stages of crime analysis as…

  1. Pre Crime analytics will help to get good quality information on different parameters of crime before actually crime happens in the field. The predictive models will help to estimate the different categories of crime so that efficient planning is possible in terms of increasing the preventive measures in the respective areas.
  2. Post crime analysis is focused in resolving the crimes rates at a faster rate. Based on the historical patterns of crime, a specific rule based clusters are formed where each cluster is associated with a specific solving principles of crime. Whenever a new crime is characterized as one of the member of the cluster, then it automatically come with a directions to resolve the crime. In other words, we are using historical information of solving the crimes to the current crime resolution.
  • There are certain analysis methods we can run in the current time or dynamic time so that instant decisions are made from such analysis. Area crime index is such measure which will created based on current crimes in the respective area and it is dynamic value with respect to time. This Index will help in modifying the current plan with respect to latest changes.

Few recommendation on the current empirical study:

In the current study, we run some models on the crime data pertaining to India and few recommendations were made as follows:

  1. This report considers the number of crimes happened in different states in India for the year 2013 to create crime index. Analysis of past 2013 data indicates that Andhra Pradesh is highly crime prone state followed by Kerala and West Bengal.
  2. In respect to severity of the crime happened, Uttar Pradesh is showing high index followed by Bihar and Madhya Pradesh. The index number with respect to lower levels of area will help the government agencies to plan the resources in a better way.

With the availability of right amount of data with all other attributes mentioned earlier, it is possible to create a tool for run time analysis of crime that can be a lot of help to take immediate decision to follow. From the historical data, different clusters can be formed according to the similarity of crime types. It can be useful to categorize the crimes and its attributes.

For the further study, we need to collect crime data not only with number of different types of crimes occurred but also with the details such as location (Rural, Urban, Industrial etc.) of crime, the day (weekdays or weekend) and time (day/night) of incidence, details of criminals (where do they stay, age, profession, education, attachment with social media, contact number etc.), distance of crime area from the nearest police station, age and sex of victims etc. These details of the data can be used for further accurate prediction of crime rates in different areas of interest.

Authors: Balasubramanyam Pisupati, Urjaswi Mallik, Prince Rajan

Robert Bosch Engineering and Business Solutions Private Limited

(Visited 130 times, 2 visits today)

The post Crime Analytics appeared first on Analytics India Magazine.

Interview – Sumeet Bansal, CEO & Co-founder at AnalytixLabs

$
0
0

sumeetbansal

Sumeet Bansal currently leads AnalytixLabs, which he co-founded in 2011. A former Business Consultant, Sumeet has worked with prestigious companies like McKinsey & Company, ZS Associates and AbsolutData in the past 8 years. He has worked in more than 10 countries spanning across Australia, Asia, Africa, Europe and USA in a multiple number of industries like High – Tech, Telecom, E- commerce, Automobiles, Pharma, etc.

He has worked extensively in domains such as Market Research, Behavioral Analytics and Customer Lifecycle Management. He has successfully helped various clients with Brand positioning, building Go-to-market strategies, Customer life-cycle management and Pricing. In his current role he is helping some leading organizations, like American Express, Jabong, Snapdeal and Indian Army on capability building. Sumeet is a motoring enthusiast, an avid reader, loves music & travel photography. He is a passionate entrepreneur involved in various tech forward ventures.

In an interview with Analytics India Magazine, Sumeet speaks about analytics education in India and how he made AnalytixLabs the leading analytics training institute in India.

AIMAnalytics India Magazine: Can you brief us about the course curriculum and pedagogy of analytics education at your institute?

SBSumeet Bansal: We have courses covering various aspects of Analytics – Data Mining and Reporting, Data Science, Big Data and Data Visualization. All courses have been crafted by the seasoned professionals and follow a structure for easy learning of the students. Our courses keep evolving given the ever-changing Analytics environment and industry requirements. Two of our most coveted programs are Data Science using SAS & R and Certified Big Data Expert. Courses now also support wider range of global certifications from SAS, Wiley, Cloudera, Hortonworks and Tableau. We also now have separate in-depth modules dedicated to advanced topics, like Machine Learning, Big Data Hadoop and one specifically curated for SAS Global certification.

As for pedagogy, ALABS follows 80:20 approach when it comes to practical vs theoretical training on various analytical concepts. This is ensured through various assignments and case studies that are provided to the students hands-on practice. The case studies and assignments provide the students exposure to wide range of business analytics problems, thereby steepening their learning curve and ensure they hit the ground running once in job.

In terms of teaching modes, there are 2 convenient options available to students: instructor- led live classes and self- paced video based training. High-degree of individual attention is given to students by giving them time post class hours in case of any doubts. Special attention is also given to students requiring help with clearing various levels of professional certifications and job interviews.

AIM: How is your institute different from other players in India providing analytics training and education?

SB: We at ALABS use a case-based approach to learning. It demands for cognitive attention i.e. stressing on analytical along with technical skills. Analytics for us, is not only about working on the tools and applying stats, but also the approach being followed and the insights being generated to drive smart business decisions. We firmly believe that analytics is an inter-disciplinary skill.

Personal attention is given to all the students by the faculty to ensure adequate mentoring and guidance for the course as well as for career support. Our students have an option of repeating any part of the course for the next one year, in case they ever want a refresher. The courses are also regularly updated based upon the industry requirements.
Now with the popularity of analytics, it is widely recognized that almost all fields today can benefit from data usage and hence analytics. Our courses are hence aimed at teaching statistical concepts and advanced analytics techniques specific to business functions and to illustrate the inter-operability of techniques amongst various functions.

To ensure this, we have a pool of faculty with unparalleled experience. This is maintained through hand-picking of analytics practitioners from the industry who also have the patience and a flair for coaching. All our trainers have on average 8-10 years of hands-on experience in the field of analytics so that they know for themselves what will help the students in their careers upon joining analytics.

AIM: What are the major obstacles facing education on data and analytics in India?

SB: While India has come a long way on this front, there are still challenges faced by all, the primary being the lack of clarity on student’s part worsened by lack of proper guidance from most of the institutes to help them understand various roles in the analytics industry and what will be suitable based on their profile.

As a first step, we provide proper and impartial counseling to our prospective students to help them understand what will be the suitable direction for them in this industry. We also give them our advice on the likely job situation for them post the courses they will pick up so that they also understand the ROI from the course that they will do. Many a times we see people running after the buzz words like Big Data Hadoop while their profile is more conducive for the Data science programs and vice-versa. Hence, it is of utmost importance for institutes to help candidates understand the various opportunities and what will be the best option for them.

Paucity of avenues where candidates can actually learn from seasoned professionals, which is very critical considering analytics is not a technical skill but an inter-disciplinary skill. Sadly we often see analytics training being provided on SAS, Tableau and R merely as software training without any real business analytics application.

AIM: Can you let our readers know about the batch profile and the typical background of candidates that you admit?

SB: We get students with diverse work experience and domain exposure. Candidates coming to us vary from graduates to people with 15 + years of experience and belonging to industries from BPO, Education, Marketing, Telecom, Banking and Finance, IT, Healthcare etc. Having said the above, a major chunk of our candidates are mid-career professionals in the experience bracket of 4-8 years. We also have senior professionals, business leaders with more than 10-15 years of experience, and young professionals in the experience bracket of 0-3 years.

This varies a lot from course to course, for eg: the Big Data course has most people coming from IT/ Database/BI/Developer/Testing background, while the Data science program might even have fresher completing their graduation/ MBA etc.

AIM: What do you see in a candidate as someone who can shape up as a leading analytics professional?

SB: Tasks in analytics cannot end by just churning out numbers using a statistical tool. To succeed in analytics it is critical to have the ability to generate actionable business insights from the data, which can be implemented to drive business value. Your tools (Excel, SAS, R, etc) will be a backbone, the application of analytics techniques will provide the guiding direction on top of the tools, while the domain knowledge will make the analytics more actionable. Hence, these are skills that we definitely search for in an aspiring candidate.

Also, in any professional training program candidates have to be in the driving seat to extract the best value from time and money invested. A trainer can coach and mentor to a certain level, but the onus still stays with the candidate to put in effort during self-study to master the subject. Many a times we see candidates who are very regular with the live classes, but hardly put effort in self-study and needless to say this doesn’t go long way. While counselling the students we ensure that they understand this aspect and suggest them to enroll only if we will be able to take out requisite amount of time for self-study and practice.

AIM: How many students are you planning to train on analytics this year?

SB: AnalytixLabs started in early 2011 and we trained around 80 students that year. 2011 was a teaching year for us also and helped us grow in the next few years. In the year 2014, we trained over 1200 students split across various courses like SAS+ Business Analytics and Big Data, both within India and overseas. This is aside from the various corporate training and Wiley’s Train – the – Trainer program that we have been involved in through the year. We have been appreciated for our course content as well as the deep involvement of the faculty with each of the students.

2015-16 hence comes to us with higher goals, trying to more than double the numbers from 2014 that we have set and will also see new courses that we plan to add to our curriculum. While we have been moving quickly on our targeted path, lots still needs to be done. Best of luck to us!

AIM: What is your placement strategy of your students?

SB: To help candidates with the placements, we provide support at various levels – beginning from profile building, referring for various positions through our wide network of corporate contacts, HR consultants and ALABS alumni, and guiding through the interview process. The guidance during the interview process is done by our experienced faculty where they help students understand what profiles are good for them, what to expect in various interviews and also conducting mock interviews. The placement process for us doesn’t end at a definite time post the course completion, but is a long relationship that we like to build. For us placements are a win-win situation for both our corporate clients and individual students.

Given the increasing number of companies for analytics hiring, ALABS now has a dedicated placement cell to look after this. The cell is responsible for scouting for new analytics opportunities, both within and outside India, and build relationships. Suitable candidates are also offered internship opportunities within the in-house R&D wing, which is focused on upcoming advanced analytics and Big Data solutions.

AIM: What are the most significant challenges you face in instrumenting an analytics course?

SB: In today’s world, analytics and data have gained much popularity, but not many understand exactly what it is. As a result, we continuously get calls from students who want to move to the “hot” field, but not many understand what it entails. We hence spend a lot of time in guiding students on what they should be expecting and what it means for them.

With the popularity of this field increasing, there are new trainers coming up all over. However, there is a serious shortage of trainers who are well equipped with the desired skills set, domain knowledge and relevant industry experience which is eventually required to prepare future professionals to meet the ever growing demand of skilled manpower in Analytics Industry.

Also, as I mentioned earlier, analytics professionals need to have the correct balance between the analytical tools and techniques and business knowledge. This also sometimes becomes tricky while designing courses to deliver the optimum balance between these given that we get candidates from diverse background as some candidates find it too technical while others find it less analytics heavy. To overcome this problem, we have launched different kinds of problems to suit candidates from technical to non-technical background.

AIM: What is your projection of the growth of analytics education in the future?

SB: Business Analytics and Big Data are the buzzwords of the day. All big organizations are interested in utilizing Analytics in advancing their businesses – more than 80% of the Fortune 500 companies today mention analytics as among the top 5 priorities, and more and more companies are joining this band wagon, thereby increasing the demand-supply gap. Till these jobs exist in the market, analytics education will continue to grow exponentially. And since the world has not tapped even 20% of analytics till date, there is a lot of scope for next 10 years at least.

AIM: What according to are the most important rising trends in analytics today?

SB: I think Big Data is the data the mega trend, which is paving the way for other trends, like real-time prescriptive analytics, text mining and Internet of Things.

These trends are going to have a deep impact on all spheres of society like how companies operate, how the world shops, how marketers market, quality of healthcare and even the road safety.
In today’s world it is well-established that organizations with strong data science capabilities have decisive competitive edge. While this is just an advantage right now, which is going to become an absolute necessity as Information Technology is today for any large organizations. Secondly, organizations that are able to marry the text/ sentiment data with their transactional data are able to extract more value through actionable insights. Thirdly, Internet of things, which in fact is another side of Big Data, has potential of bringing life-transforming changes in various spheres of our society. With number of connected devices increasing 3-4 folds in next 5 years, will generate unprecedented amount of data that will even dwarf what we refer to as Big Data by today’s definition.

AIM: Anything else you wish to add?

SB: When we look back today, we have had an interesting journey since we started in 2011. From early days till now, a lot has changed – from AnalytixLabs reaching out to organizations to explain them the value of analytics to companies reaching out today proactively to build advanced analytics capabilities. The demand for analytics professionals and hence analytics training has surged exponentially keeping us on our feet always to constantly adapt to the rapidly evolving analytics environment, in the last 2 years particularly, with the advent of new Big Data tools and techniques, We see this industry to be growing even at a faster pace in the coming years and AnalytixLabs looks forward to contribute and being a part of this revolution.

Watch Sumeet Bansal’s workshop at CYPHER2015

(Visited 537 times, 9 visits today)

The post Interview – Sumeet Bansal, CEO & Co-founder at AnalytixLabs appeared first on Analytics India Magazine.

Top 10 Analytics Training Institutes in India – Ranking 2015

$
0
0

A data scientist needs to have skillsets in a wider horizon and is expected to not only have knowledge in statistics and coding but also should be good in visualization and storytelling. Data science is a constantly growing field with new tools and techniques being introduced and older ones getting obsolete frequently.

The demand for such trained professionals outgrow the training institutions in both quality and quantity. Many boutique-training institutions are taking a note and bringing their own offerings in this field. But how many of these courses are relevant and meets the expectation of the industry.

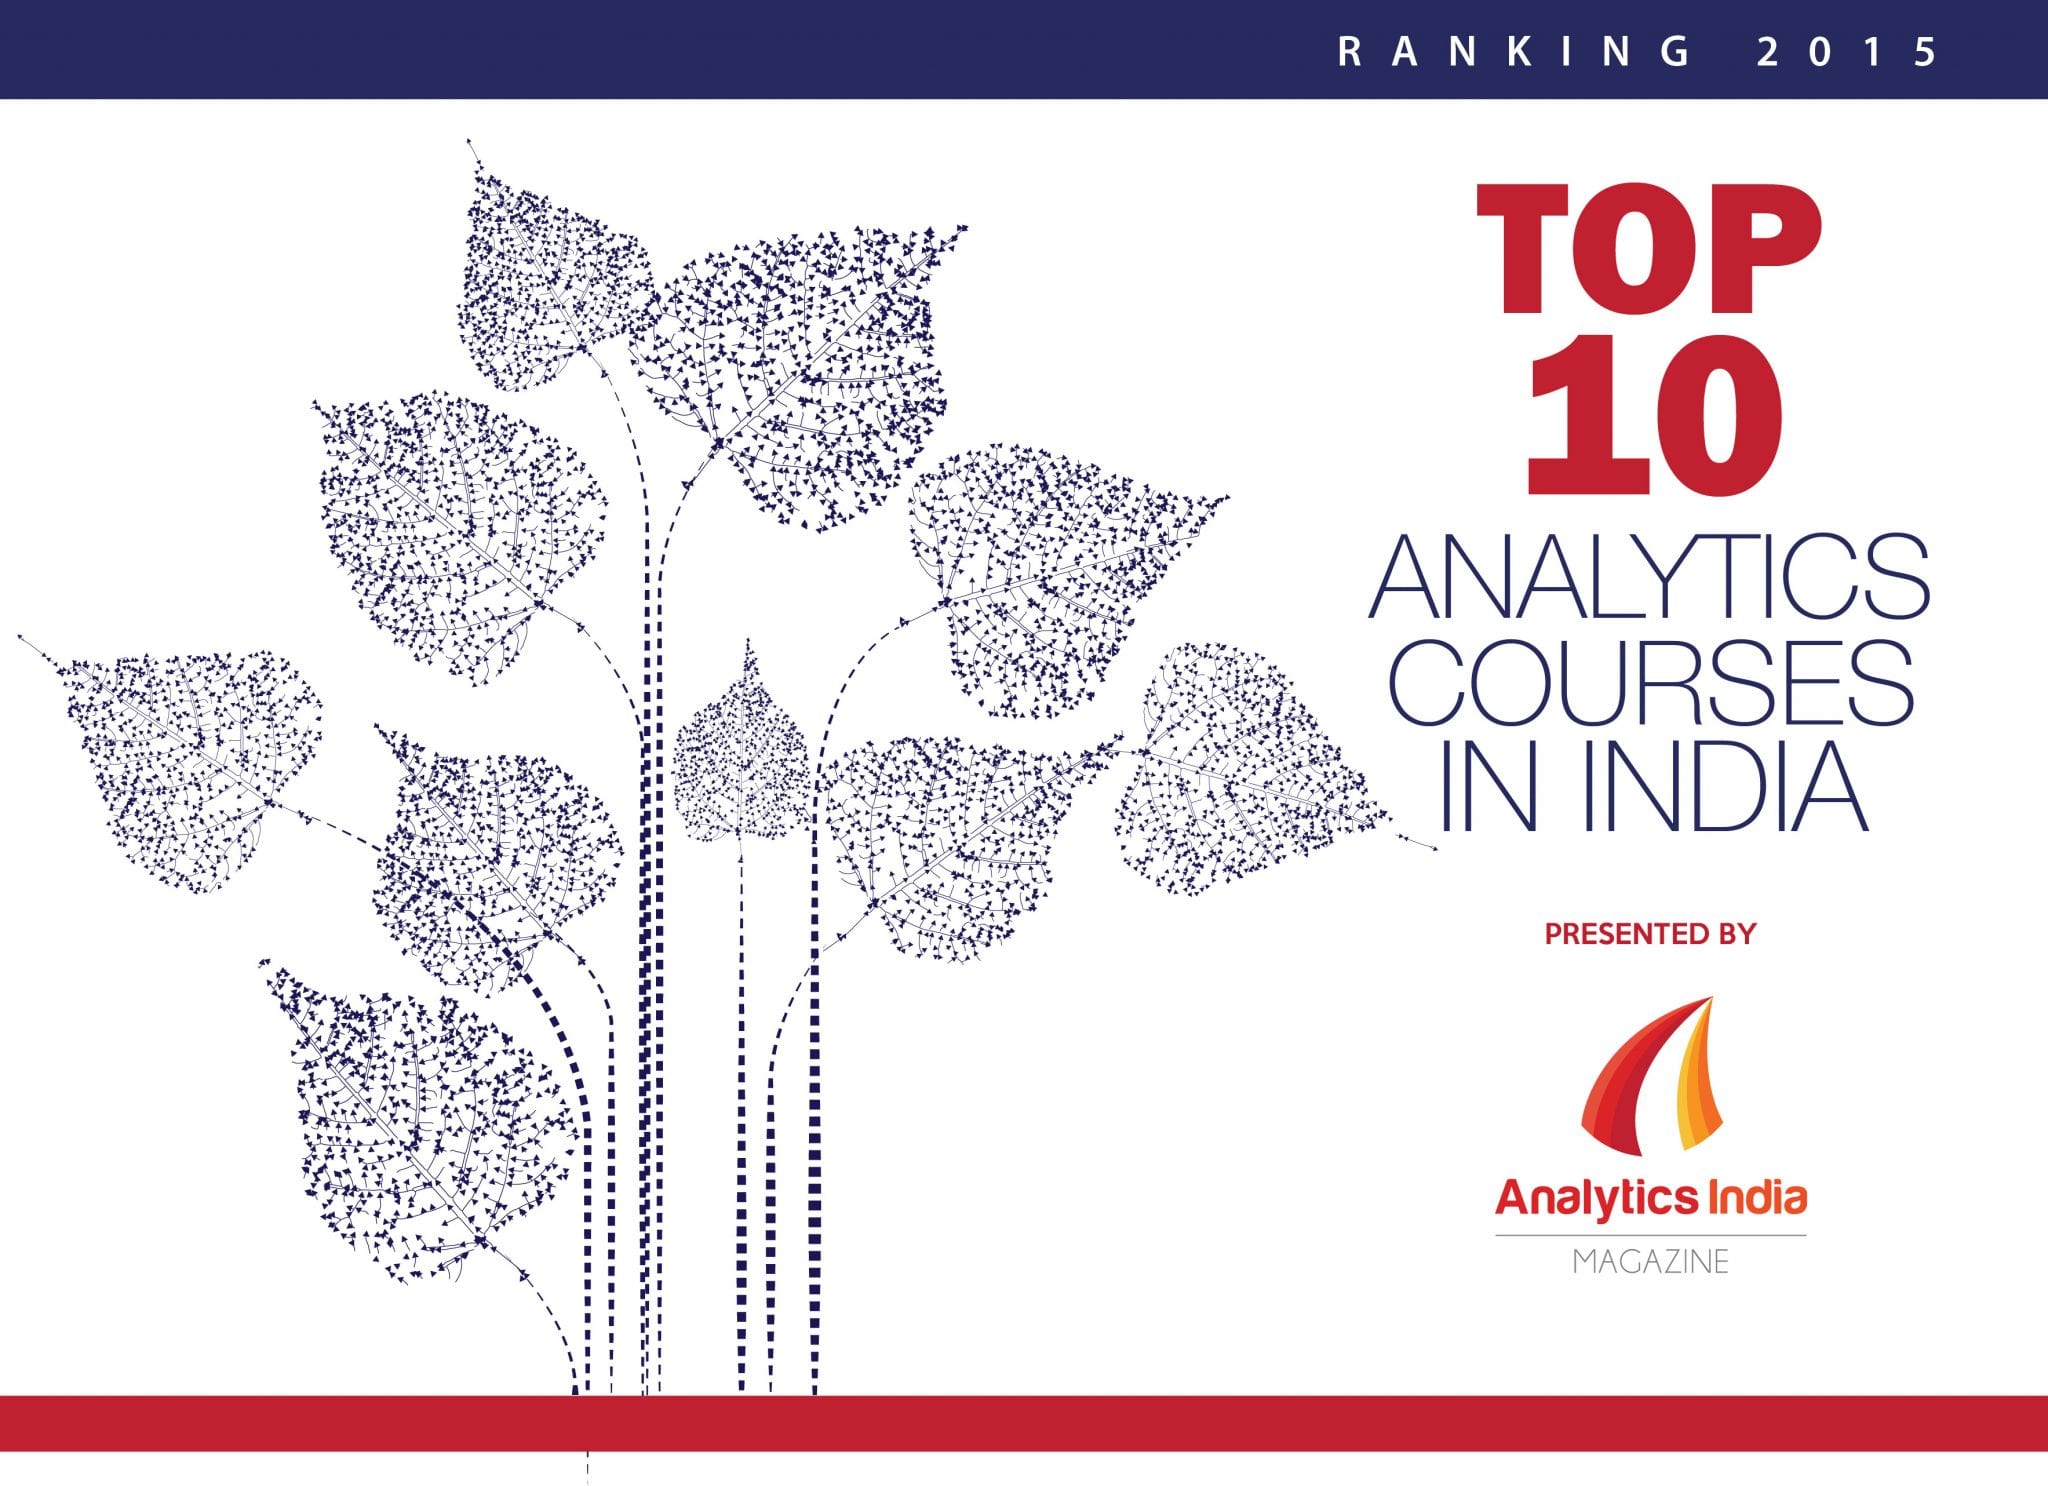
This is our annual ranking of top 10 analytics training institutes in India. Here we bring to you the top analytics education institutions in the country by meticulously going through the institutes and their offerings. The institutes are ranked on the following 5 parameters, just like each year course content, pedagogy, external collaborations, faculty and addition features like Virtual Labs, Placement Assistance, Events etc. This year we got more than 15 institutes taking part in this ranking. We take into account student as well experts feedback to carve out this cherry-picked ranking of just 10 institutes.

1. AnalytixLabs

Analytixlabs

Mode of delivery: Online & Classroom

Headquarter city: Delhi/NCR

Cities operating in: Global (through online and onsite training)

Flagship program: Data Science with SAS and R, Certified Big Data Analyst

Year instituted in: 2011

alabs1

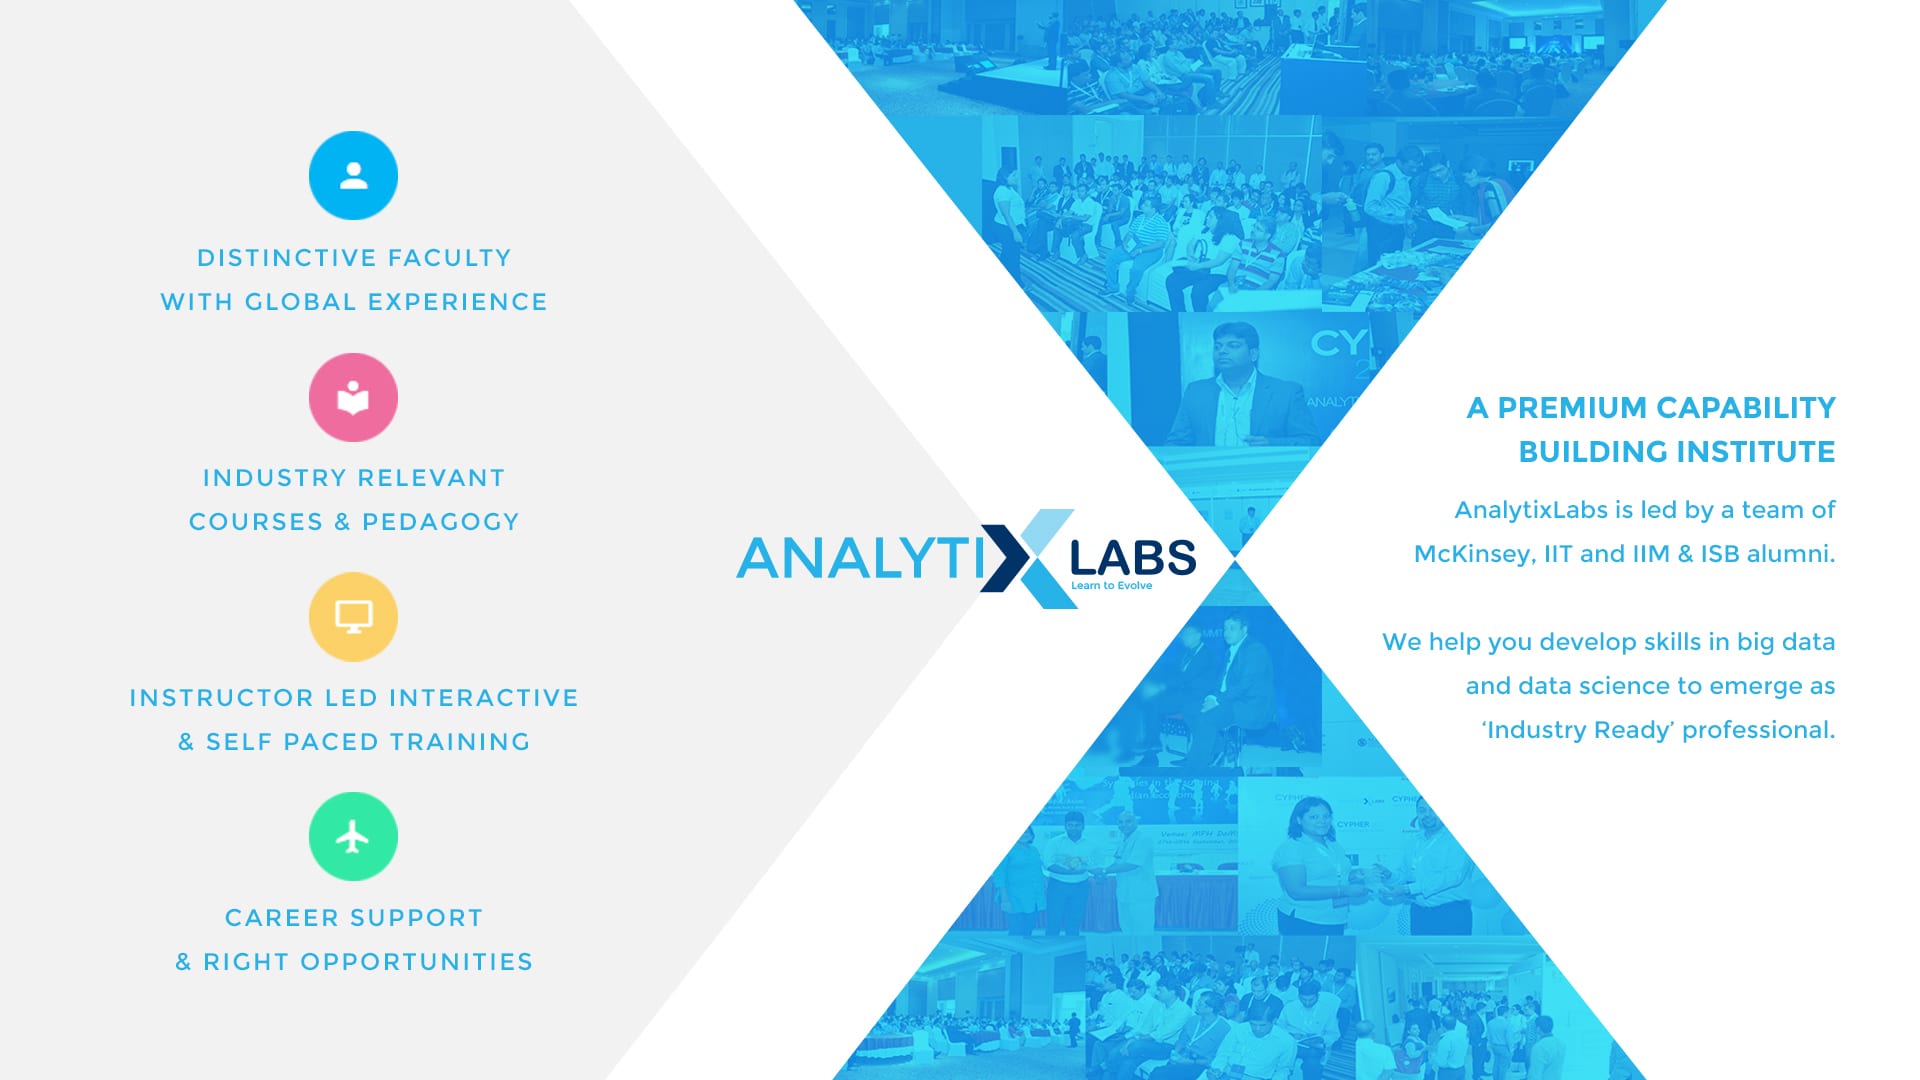
AnalytixLabs is a capability building and training solutions firm led by McKinsey, IIM, ISB and IIT alumni with deep industry experience and a flair for coaching. ALABS pioneers in high quality online and classroom training since 2011. Their USP is industry focused and job-oriented courses along with a high degree of personal attention from the faculty. They offer a wide array of courses in Data Science, Big Data Analytics and Data visualization along with global certifications. Apart from individual professional training, they have worked with prestigious clients, like American Express, BlackRock, EXL Services, Jabong, Snapdeal, Times Group, Tech-Mahindra and even Indian Army.

  • Team together has over 50 years of rich experience in Analytics & Consulting and the trainers are handpicked from leading firms like McKinsey, Deloitte, Genpact, Fidelity and Facebook.
  • Case study based modules crafted by experts based on real life business scenarios ensure that participants learn practical applications and get flavors of various analytics problems, thereby steepening their learning curve.
  • Dedicated placement cell and counselling by a panel of experienced faculty members who have had first-hand experience in analytics recruitments.
  • Suitable candidates are also offered internship opportunities within the in-house R&D wing, which is focused on upcoming advanced analytics and big data solutions.

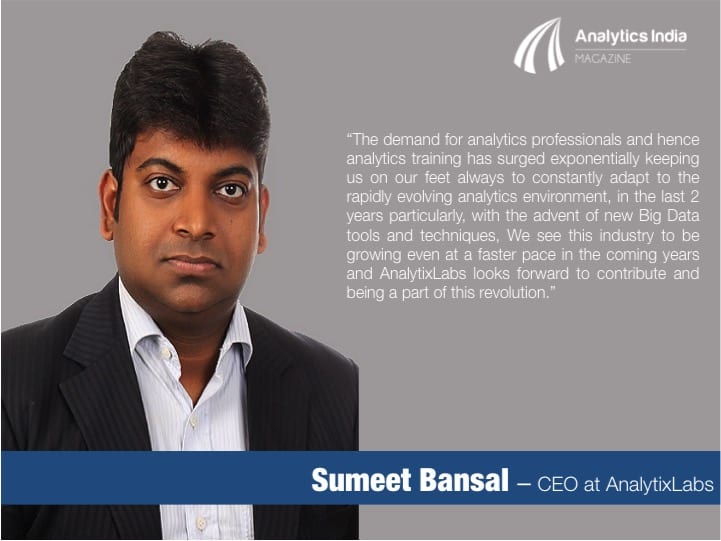
Read Interview with Sumeet Bansal, CEO & Co-founder at AnalytixLabs

2. Edvancer

edvancerMode of delivery: Online

Headquarter city: Mumbai

Cities operating in: Online and hence everywhere

Flagship program: Certified Business Analytics Professional

Year instituted in: 2013

edvancer

Edvancer has been providing analytics, data science & big data training globally for the last 2 years and has trained thousands of people in this time period. It is an IIM-IIT alumni venture which provides the most practical, industry focused, hands-on, cost effective courses which enable students to gain skills needed by industry. Edvancer has been awarded the Big Data Training Institute of 2015 by Silicon India Magazine.

Edvancer offers courses in Business Analytics, R, SAS, Hadoop & Big Data, Text Analytics, Banking Analytics, Python for Analytics etc. Edvancer’s courses are designed & delivered by industry experts who are rigorously evaluated to select the best experts to create and deliver the best courses. Satisfaction levels with Edvancer’s faculty are very high and is a big differentiating factor for the institute. Edvancer conducts trainings through live, instructor led, online classes. These virtual classrooms provide complete interaction with the trainers and other participants and work just like a normal class. They use a case-study based methodology within their courses with a focus on working hands-on on the concepts. Some of the courses are also provided through a ‘Self-paced + Faculty support’ pedagogy where the trainees can learn through recorded videos at their own time & pace and can get faculty help for any doubts or queries. Edvancer offers placement assistance to the students and in the past several of their students have got interview opportunities and placed with various firms like Hansa Cequity, TCS, ICICI Lombard, Smartcube, Eclerx, Atos Origin, Capgemini, Accenture etc.

3. International School of Engineering (INSOFE)

insofe

Mode of delivery: Classroom

Headquarter city: Hyderabad

Cities operating in: Hyderabad

Flagship program: Certificate in Engineering Excellence (CPEE) – Big Data Analytics and Optimization

Year instituted in: 2011

International School of Engineering (INSOFE) has been conducting world-class classroom based training in Big Data Analytics and Optimization for over 4 years, having 600+ alumni. Its certificate program is certified for its quality of content, pedagogy and assessment by the Language Technologies Institute (LTI) in the School of Computer Science (ranked #1 in the world by US News and World Report) at Carnegie Mellon University (CMU).

This program is also listed #3 (#2 among academic institutions) in the world by CIO.com for “Big Data Certifications That Pay Off”. INSOFE is flanked by Columbia University and Stanford University in this list.

INSOFE’s flagship certificate program, CPEE (Certificate Program in Engineering Excellence), has scored another first by being the first certificate program in the world to offer complete tuition waiver and paid internships. In every batch, INSOFE offers this fellowship to a few people with work experience ranging from 0-5 years, after due process. This certificate program is weekends-only and spans a duration of ~6 months.

INSOFE’s focus on high quality applied education has led to many companies actively engaging them for their corporate training and Centres of Excellence building needs. INSOFE has conducted such trainings for organizations in India, US, UK and Middle East.

4. Imarticus Learning

Analytics-Banner

Established in 2012, Imarticus is India’s leading Analytics professional education company, which assists individuals and firms in meeting their human capital and skillset requirements through our range of bespoke training programs. Imarticus is headquartered in Mumbai, and has presence in over 10+ cities in India.

  • Experienced Educators: Having educated over 10,000 individuals, Imarticus is in a unique position to understand the learning needs of aspirants and design it’s training to be stimulating & relevant. Imarticus has a range of customized delivery methods such as classroom training, elearning, workshops and seminars that are delivered globally and are managed by a fully integrated learning management and governance system.
  • Coverage: Imarticus has training capability across various analytics techniques and tools such as R, SAS, Python, Big Data, Hadoop, Data Visualization, Tableau and more. Imarticus is led by senior professionals from universities such as Columbia, MIT, Harvard and INSEAD, with 150+ years of combined experience in the Technology, Analytics and Financial Services domain. In addition, Imarticus has over 10+ dedicated analytics faculty and over 30+ empaneled faculty members in the field of Analytics.
  • Corporate Connect: Imarticus is the preferred sourcing & corporate training delivery partner for over 80 firms, which include leading Global & Domestic Banks, Consulting, KPO’s, Technology & Analytics firms.

5. Edureka

edureka-logoMode of Delivery: Online Live Interactive Classes

Headquarters: Bangalore

Cities operating in: Online Delivery

Year instituted in: 2011

Edureka is India’s fastest growing online education marketplace for live, interactive courses in technology and business verticals. Edureka currently offers over 75 courses ranging from big data and analytics, to mobile programing, to digital marketing and professional certifications; all taught by top industry experts.

Edureka-Team-ImageEdureka follows a highly effective delivery model of instructor-led live online classes with 24×7 support and free lifetime access to all the course content. This content resides in a state-of-the-art Learning Management System (LMS).

Edureka’s course content is up-to-date with industry requirements and is aimed at students and professionals who want to up-skill themselves. Many of these learners are interested in working in the analytics industry and are keen to enhance their technical skills with exposure to cutting-edge practices.

According to NASSCOM, analytics market in India is expected to double to $2.3 billion by FY18. To this end, Edureka is bridging the talent gap through courses on new technologies – particularly in the fields of Big Data and Analytics. These courses are helping professionals gain the right skills and knowledge required to build a successful career in the analytics industry.

Some of the popular analytics courses at Edureka include Big Data & Hadoop, Mastering Data Analytics with R, Data Science, Data Visualisation, Hadoop Administration, Apache Spark and Scala and Digital Media Analytics.

6. IMS Proschool


1368766567phpyBzZfeMode of delivery
: Classroom and Live Virtual Classroom (webex platform)

Headquarter city: Mumbai

Cities operating in: Mumbai, Navi Mumbai, New Delhi, Bangalore, Chennai, Hyderabad, Pune, Bhubaneshwar

Flagship program: NSE India Certified Business Analytics Program

Year instituted in: 2014

IMS Proschool, in association with NSE India (India’s largest Certification body in Finance) offers Business Analytics Certification Program. Proschool along with the Parent company – IMS Learning Resources, has trained more than 300,000 candidates for different competitive exams and various professionals courses in Finance, Accounts & Analytics etc.

Proschool has also trained more than 16,000 employees of different BFSI companies such as ICICI Group, State Bank of India, Citibank, Kotak Group, etc.

IMS Proschool is a partner of NSDC – National Skill Development Corporation, an initiative of Union Ministry of Finance to provide skill development training to the youth.

Designing and delivering a Business Analytics (BA) Training Program is very challenging since it is a cross functional area that requires understanding of statistical techniques, data extraction and management with IT tools as well as the domain knowledge where the analytics may be used. At the same time the trainees also have varied backgrounds ranging from IT to management or commerce graduates with no work experience.

IMS Proschool Program has evolved to achieve a fine balance between these divergent and vast areas. We believe the program now blends the right amount of stats, IT and domain and can be understood by most trainees even with different backgrounds.

7. Manipal Pro Learn

Manipal Pro LearnMode of delivery: Online – Instructor Led

Headquarter City: Bangalore, India

Cities Operating in: All India

Flagship Program: Big Data Analytics using Hadoop

Year Instituted in: 2014

The Big Data Analytics course using Hadoop from Manipal ProLearn is designed to provide a comprehensive learning experience to those who intend to create a career in analytics. It is targeted at software professionals, project managers, testing professionals and fresh graduates. The learners are trained through multiple mode such as video lectures, reading materials, online-practice sessions, case studies and webinars from subject matter experts. The program is of 120 hours duration.

Manipal ProLearn is the online marketplace for certifications from Manipal Global Education Services. The certification programs aim to bridge the skill gap prevailing in emerging areas of analytics, digital marketing and IT.

8. IVY Pro School

ivyproMode of delivery: classroom/ live online ILT/ LMS

Headquarter city: Kolkata

Cities operating in: Kolkata., Bangalore, New Delhi, shortly opening in Pune

Flagship program: Business Analytics Programme

Year instituted in: 2007

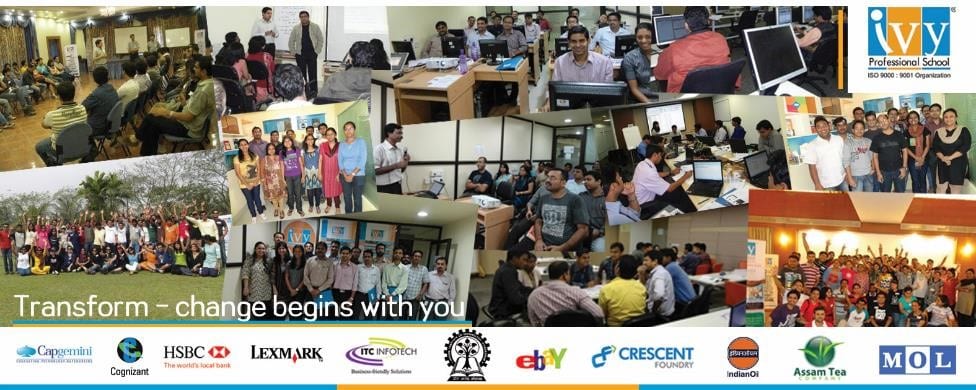
Ivy® Professional School (Ivy) is a pioneer in the Big Data Analytics and Data Science training in the country since its inception in 2007.

Course Content:

Ivy’s programmes on Business Analytics, Big Data, Data Visualization and Advanced Data Scientist have become benchmark courses for several analytics companies for training and skill development.

Besides the core courses, Ivy offers Live Projects / Internships Backed Comprehensive Short-term Course Packages for Individuals, Problem Solving workshops and career enhancing workshops in the form of Communication Skills, Resume Building, Interview Sessions etc. to its students.

Achievements:

  • 10,000+ trained from 10+ countries, 50+ corporates and 100+ colleges (including IIMs, IITs, ISIs, etc.).
  • Conducted Risk Analytics batches in US for large analytics firms
  • Free Webinars on Cutting Edge Analytics Concepts / Tools

Industry Collaborations

  • Ivy helps Analytics firm in selection and training of candidates. These candidates are absorbed after assessment by the firm. (In the past such batches have been conducted for companies like Mu Sigma, Genpact, Affine Analytics, etc)
  • Ivy is the official training partner of Genpact, HSBC, eBay/Paypal, ICRA Online, ITC Ltd., Capgemini, Cognizant,mJunction, Lexmark Inc., etc

Placement Assistance

  • 65+ analytics companies have recruited Ivy’s candidates through its dedicated Career Center team.
  • Life-Time Access to Ivy’s Analytics Exclusive Job Portal

9. NIVT

NIVT banner

Mode of delivery: Online & Classroom (Both)

Headquarter city: Kolkata

Cities operating in: Kolkata

Flagship program: Different Skill Development training program under Skill Development Initiative Scheme, Govt. Of India.

Year instituted in: 2003

NIVT® -the training brand of Novel Research and Development India (P) Ltd.” Incepted in the year of 2003 based in SDF Building, Webel Electronics Complex, Salt Lake City, Sector-V, Kolkata, WB, India is the premier training provider in the field of Business Analytics, Data Science and Information system management.

NIVT is an innovative concept of imparting technology training to young professionals in niche areas starting from beginner’s courses to Data Analytics, Business Intelligence tool and other emerging technologies. We aim to fill up the huge ‘Skill Gap’ in the analytics industry across pan India. Our courses in business analytics are designed to embed business orientation, statistical and data mining skills to enable candidates to apply business analytical techniques in their work areas immediately after completion of the courses.

NIVT focuses on offering project based Analytics training on Market Research & Retail Analytics, Financial Analytics, Clinical Analytics; Social Media & Web Analytics, HR analytics, Fraud Analytics etc. using the emerging technologies like Base SAS, Advance SAS, SAS Analyst Application, R Programming, SPSS, Advance excel, Big Data Hadoop, Python, Tableau etc.

We have a proven track record of placement in different organizations. The Placement Cell arranges interviews for students by the prospective employers, and monitors on-job training. Majority of students get proper and satisfying placement.

10. Orange Tree Global

OTG LogoMode of delivery: Both Classroom and Online

Headquarter city: Kolkata

Cities operating in: Kolkata, Mumbai, Pune, Gurgaon

Flagship program: BIBA (Business Intelligence and Business Analytics Program)

Year instituted in: 2010

OrangeTree Global is a leading Business Analytics and Business Intelligence Training organization with Centers across India. The organization focuses on Business Intelligence tools like SAS, R, SPSS and VBA. The case study centric approach ensures that students and professionals learn and master the application of Analytical techniques on Business Intelligence Tools. With regional offices across Mumbai, Pune and Kolkata the company has been providing analytics training to some of the largest FMCG, Financial Institutions, Media Houses, prestigious educational institutions and IT companies in India for more than 5 years now. Some of its clients comprise ITC Limited, Reliance, IIT Kharagpur, Yes Bank, St. Xavier’s Mumbai.

Training is provided through live classrooms sessions and online and are aimed at working professionals and smart fresh graduates who aspire to join the Analytics industry. The full program spans over weeks and covers modules on Business Analytics taught on Business Intelligence platforms such as SAS, R, SPSS and VBA. Tableau.

Students who complete the course successfully are then required to sit for an in-house certification examination. The answer scripts are circulated amongst the different centres and graded by different faculty members. The certificate issued has been named the BIBA (Business Intelligence and Business Analytics) certification and it is now a widely accepted certificate.

(Visited 5,224 times, 225 visits today)

The post Top 10 Analytics Training Institutes in India – Ranking 2015 appeared first on Analytics India Magazine.

Deploying Big Data Technology for 360° Customer View

$
0
0

The advent of Big Data in the last few years have made a huge paradigm shift in how organizations across industries make data driven decisions. Customer behavior is a key aspect where companies have been using modern Big Data technologies to get a 360- degree view of customers from different angles. With more and more products and services being available digitally, companies want to know more and more about their existing customers and prospective new customer not just within the parameters of their interaction, but also on what else he or she is interested in. A holistic view of a customer personality helps companies not only to tailor their products and services better, but also communicate with greater relevance to differentiate themselves from the clutter.

Analysis of customer sentiments, changing needs, and evolving trends can be tapped by merging in diverse internal and external information. Internal data, typically owned by the company contains data like transaction details, campaign performances, customer service history, loyalty programs, and customer satisfaction. External data covers category information, demographics and geographic details, lifestyle – attitude- psychographics and social media data.

The challenges in integrating these data sources are vast, and can’t be handled by traditional systems. Big Data platforms have the capability to deal with such vast variety of data, which are terabytes in volume and are generated at a very high speed. Distributed computing and cloud systems enable merging, handling and result generation from these diverse data sources.

The Big Data Environment:

absolut1

Big Data technologies have already proven to be highly advantageous over the traditional RDBMS systems, which are critical for modern Customer Management:

  • Speed – High Speed Data Mining due to parallel processing
  • Volume – Handles large amount of data
  • Set Time – Has lower set up time
  • Cost – Cheaper than RDBMS for significantly large size of data
  • Scalability – Highly scalable and flexible with growing need
  • Variability – Handles unstructured data and ready for text analytics

With greater clarity, organizations can drive up their revenue by getting the right information for the right customer at the right time and act on it. Broadly there are 5 steps to using Customer 360 info for maximum results:

  • Listen – to what the existing customers are saying about the company products and services. Improve areas of concern, build on areas of strength
  • Understand – how customers interact with the company and category in general. Get early symptoms of industry changes and new trends.
  • Assess – how well customers are served currently. Identify areas of improvement, cross-sell upsell opportunities
  • Improve – interactions through customization. Each customer should feel he is getting individualized attention from the company. His experience of every interaction should be smooth and easy going, leaving him with a wow feeling every time he is in touch with the company
  • Strengthen – relationships with customers by engaging with them through channels and offerings most relevant to him or her

The customer view approach should be considered across:

  • Past – A meaningful and accessible view that includes purchases, interactions across channels, campaign response etc.
  • Present – Key information about who they are and how they relate to the brand, triggers for current interactions and recent history
  • Future – Actions that can influence future behavior and relationship. Actions to prevent churn, drive up-sell & cross-sell & maximize LTV

Customer 360 – Build Stages & Data Types

absolu2

The journey for Customer 360 process consists of 4 broad phases:

  • Create Unique Global Consumer ID – Create coverage for members, non-members, new customers, across brand integration, regional overlaps, household information etc.
  • Internal data – Transaction information of existing customers, historical customer service details, customer satisfaction measures, web activities, loyalty programs, social activities
  • External data – Category information, related category trends and events, geographic and demographic profile, attitude and psychographics information, competition analysis
  • Predicted – Propensity and affinity of purchase, pursuadableness of customers for upsell cross-sell, conversion of prospective customers.

The trend is set, movement is on. Some industries have adopted Big Data earlier than others and are already seeing significant improvement in their customer satisfaction and revenue upliftment. Big Data is fast becoming the standard across companies and industries for improved Customer 360 degree view and action.


Authors:

Mr.Titir Pal(Head of Products & Solutions at Absolutdata Analytics)

Mr. Rajat Narang (Associate Director at Absolutdata Analytics)

(Visited 98 times, 3 visits today)

The post Deploying Big Data Technology for 360° Customer View appeared first on Analytics India Magazine.

Establishing a New Meaning for Data Flow

$
0
0

Three-quarters of a billion people have no access to clean drinking water, and the United Nations estimates that 3.3 billion people are living in areas of water scarcity—that’s almost half the population of the entire planet. 80 percent of all sickness and disease worldwide is related to contaminated water, and by 2025, it is estimated that two out of three people will live in a water-stressed area.

Water-stressed areas aren’t just limited to developing countries, as nearly every state west of the Rocky Mountains in western USA is affected by water shortages. The most severe example is in California, which has been experiencing its worst drought in 1,200 years.

It’s no coincidence that in 2010 our first philanthropic donation as a company came in the form of Qlik licenses for Circle of Blue, who wanted to use Qlik to report on diminishing supplies of clean fresh water at World Water Week. Five years later and water is still top of mind.

Representatives from Qlik recently attended the Clinton Global Initiative (CGI) Annual Meeting, where global leaders convene to create and implement innovative solutions to the world’s most pressing challenges. Qlik CEO, Lars Björk, served on a panel titled “Hacking the Solution: Connecting Experts From Technology and International Development”, which addressed opportunities to adapt information and communications technologies for developing country contexts.

One of the highlights of the CGI Annual Meeting is selecting “Commitments,” which are new, specific, and measurable plans to address a specific, significant challenge. We are very proud to announce that Qlik’s submission, “Groundwater: Data to Drive Action Toward Sustainability,” was selected as an exemplary approach to aggregating data on an open, visual platform! Qlik’s CGI commitment partners include Circle of Blue,Columbia Water CenterUniversity of California IrvinePacific Institute, and Twitter.

This multi-partner commitment will launch with a pilot data visualization app driven byQlik Sense with data support from Twitter, that analyzes groundwater supplies and related water flows in California and the American West.  The commitment will expand its scope to national and then to global groundwater supplies, providing a visual, trusted, cumulative, and collaborative resource for decision makers, researchers, media, and the public.

Today, we serve approximately 200 global charities, which is a testament to the value delivered by Qlik products, the passion of Team Qlik and our unwavering commitment to Corporate Social Responsibility.

By Evan Siff – Social Media Manager at Qlik

(Visited 64 times, 3 visits today)

The post Establishing a New Meaning for Data Flow appeared first on Analytics India Magazine.


People Analytics for Employee Engagement

$
0
0

The last few years have seen the emergence of analytics as a potential force for driving data based decision making in HR. Traditionally, Human Resource Management forms the policies and practices that define the workplace culture of the company. It deals with identifying, hiring, training, motivating, and retrenchment of workforce. Human Capital Management on the other hand is the strategic issue that systematically seeks to analyze, measure and evaluate how these policies and practices create value. HR Analytics is one such practice under HCM. It is a combination of software and methodology that applies statistical models to worker-related data, allowing enterprise leaders to optimize human resource management. Genpact has been using people analytics successfully to drive employee engagement over the last 2 years.

Gallup, a research-based global performance management consulting company, in their recent survey found that concentrating on employee engagement can help companies withstand, and possibly even thrive, in tough economic times. It advocates that companies with high engagement have a 20% boost in productivity and profitability. They also said that globally, only 13% workers were engaged.

Engagement reflects upon organization’s operational capabilities from the viewpoint of its employees such as Leadership, Change Advocacy, Work Culture and other important competencies. It can help highlight issues like reasons for attrition and incompetent leadership. It can also predict well in advance the dissatisfied or unhappy employees who might either eventually attrite or their performance suffers due to lack of focus which finally leads to firing. In both the cases, the company ends up exhausting its vital resources like money and workforce in filling up those places again. It is a fact that retention is always cheaper than recruiting. Therefore, if unhappy/dissatisfied/disengagement employees could be predicted it, will help in forming an effective retention policy specific to individual problems or at least help in understanding the problem itself if not able to retain. With HR more and more becoming a strategic partner in helping a company achieve its goals, organizations today are looking at employee engagement to be a driver of business outcomes.

With tools to manage onboarding, performance management, succession planning, workforce analytics and HR Management, Howden, an engineering firm has increased HR process efficiencies and retention of its top talent, while decreasing time-to-productivity for new employees and costs associated with employee turnover.

Genpact has worked extensively in the area of attrition. The basic premise they work on is that dissatisfaction leads to unhappiness at work which causes disengagement and ultimately attrition.

The analysis at Genpact begins with a complete database of employees containing details since the time of their joining. Along with various attributes like age, gender, date of joining, date of birth, date of leaving, days in band etc., they also collect a first line manager survey (FLM Survey), which is designed to get ratings of managers from subordinates based on Six leadership competencies namely: Business Acumen, Change Advocacy, People Leadership, Execution, Effective Communication, Customer Centricity.

Apart from this, they also have performance ratings of the employees which categorizes them according to their potential. They also undertake a lot of engagement initiatives and keep records of the employees who participate. Training data is also available of the employees who have undertaken trainings and their performance on those as well as their other achievement.

Genpact has found a positive relationship between the performance ratings and their FLM surveys. Using this data, they were able to identify factors which are important for employee retention and which enhance an employees’ sense of engagement. Once this is done, they can better engage the employees by using the analytics data in the following ways:

  • They are able to prioritize the initiatives out of the basket of engagement activities, which have the maximum impact and are able to redirect investments to the more beneficial ones.
  • Using analytics they can predict employees who are at the highest risk of leaving the organisation within the next 6 months and can design interventions to rehire them or re-engage them to minimise the risk of attrition.

This becomes very important for them as they invest a lot of resources in training and developing their employees. Therefore, every employee who leaves is a drain on the resources.

(Visited 14 times, 14 visits today)

The post People Analytics for Employee Engagement appeared first on Analytics India Magazine.

Connect With Your Customers – Unlock the Potential of Unstructured Data

$
0
0

Innovation starts with knowing your customers well. As the number of interaction channels with customers’ increases, the challenge of aggregating information and insights from such customer interaction sources becomes increasingly complex.

Banks are relying on various channels for end-user touch points. Today banks use a mix of traditional and contemporary channels that provide customers an ability to enquire, complain or request for services. The traditional channels being email, websites and customer (call) centers. With today’s trend being social, banks are also embracing social media as a means for customers to reach out to them. Social media provides the dual advantage of being a quick information dissemination tool for the banks. Although banks have invested in setting up infrastructure for these touch points, use of information generated from these touch points is still not optimized. Lack of cross platform information sharing, coupled with silo approach to relationship ownership creates barriers for having a 360° degree view of the customer, thereby losing out of tremendous knowledge and insights.

Customer touch points are notorious for generating unstructured data. Due to the nature of this data, often companies struggle to link data across various channels. This is where innovation is required. Top companies have started investing in unstructured data analysis, to link customer activities with their interests and satisfaction with the system.

It is important to understand and analyze unstructured data from disparate sources as a whole. Doing this quickly and securely, at scale is a competitive advantage. The recent proliferation of Big Data technologies has ensured that banks can have the capability to process huge volumes of unstructured data, typically in the form of social media, e-mails, call center data, SMS messages, customer survey & feedbacks etc.

hp1

With an increasingly large number of people willing to adopt multi-channels like complaint logs, feedback forms, IM Chats, social media for conducting business, it has made a fundamental shift in the way banks interact with prospects, customers, employees and other stakeholders. These channels contains information in the form of unstructured text, images, and subscriptions to specific communities, and so on. It is very important for Banks to understand the techniques that can be applied to a given type of data to extract meaningful information and build Customer analytics and Risk Management models on top of this. Also insights and analysis from external data like social media help banks analyze, understand, and predict market movements to enhance business outcomes. According to research by McKinsey, banks with advanced capability of using analytical solutions have a 4% – 6% point lead in market share over banks who do not.

However, perfecting these analytical solutions is not easy and banks are struggling to make meaningful inferences from increasing volumes of data and are only using a small portion of this unstructured data to generate insights that enhance the customer experience.

Unstructured Data insights for better connect with customers

Banks should have an effective strategy & framework and analyze unstructured data not only for awareness or marketing purpose but also to find early warning signal, competitive analysis, emerging trends, risks and threats.

For better connect and customer experience, the key is to integrate customer service, marketing and other banking processes with data driven insights. To attain that, banks should have an analytical platform to ensure intelligent decision making and customer targeting by mining unstructured data from varied sources.

The list of areas where unstructured data can be used for banking is restricted only by one’s imagination, but here are some areas we have seen emerge as top use cases:

  • Deeper understanding of Customer preferences & sentiment
  • Satisfaction Index & Level of customer service
  • Topic of Interests (Supervised Deep Dives)
  • Early Warning Signals
  • Recommendation Engine
  • Context Based Analysis
  • Customer Churn

hp1

Transform Unstructured Data into actionable insights

There is no question that there is a great interest in mining unstructured data, but it’s a vast space in terms of breadth and depth. Companies may look at some of the below areas to understand what insights can be generated from unstructured data:-

  • Mining disparate data sources for themes: Using data connectors & automated ETL process, companies can extract data from multiple sources, including data stored in enterprise systems such as Microsoft Exchange & SharePoint, other enterprise applications, as well as data within cloud services such as Salesforce.com, and Google Drive. One could mine the data to identify trends/threats, or to find references to topics of interest, and common themes across these disparate data sources
  • Stock performance vs. Social Sentiment: There’s a growing movement around using social media sentiment as a stock guide. Social sentiment can be used as a helpful predictor of stock price fluctuations and supplement traditional fundamental and technical analysis. With help of sentiment analysis, one can get insight into what end customers are saying about brand’s products and services and analyze how sentiment changes over time
  • Early warning signal on Incident Data: Nowadays, people are spending excess time on social media sites like Twitter, Facebook and other Forums sharing & seeking information on banking services. Banks can analyze tens of thousands of customer-service related comments shared on Web forums, blogs and other social media sites which can be harnessed as an early-warning signal of adverse incidents resulting from payments/transfers, login/sign-in issues, service not available etc. This will enable Banks as an early warning signal to reduce the incidents before it cascades into a major problem. In a field where any wrong banking transactions have significant liability and consequences, “the idea is to get the initial signals earlier, allowing them to investigate leads sooner, and resolve the issue & not escalate it.”
  • Call center Analytics: keeping a customer happy is more important than ever before, customers are using multiple channels like Twitter/Facebook or phone calls to vent their opinions, grievances etc. Voice is still supreme but social media & online communities have changed the name of the “call center” to the “contact center”. Speech analytics on voice and sentiment scoring on voice/social platforms allows a business to detect an unhappy customer during a call or a tweet, predict that they are likely to churn, and extend a retention offer to keep that customer. Because of the advent of new social channels, fresh analytics approaches & methods are required for enhancing customer experience and retention
  • Intelligent Business Operations with Video Analytics: With the advent of advanced video analytics capability, organizations now can identify events, attributes or patterns of behavior through video analysis of monitored environments to create intelligent business operations. With video analytics, companies are taking situational awareness to another level and optimizing customer service and operations with valuable insights around object detection, classification, behavioral patterns, threats, compliance etc. from recorded & streaming video data
  • Enter the technique of graph analysis: Zynga uses HP Vertica in a massive cluster for social graph analysis to discover relationship of their customers – “the players of their games” that enables them to improve the player experience and average revenue per user. Here is a detailed post on this “Uplevel Big Data Analytics with HP Vertica”. Vertica provides a highly scalable and fast engine for iterative graph algorithms. These type of use cases are not only relevant to the Zyngas and Facebooks of the world but to any company or organization that has a connected user community. From online communities, forums to user-to-user call logs, social networks are everywhere and finding relationships, influencers & customer behavior is the key to monetizing them

With a strong framework & technology in place, Bank will be able to propose their best banking product at the right time according to user needs & interests.

Conclusion

Analyzing unstructured data is going to be increasingly important for banks as customers demand high levels of service. Strong strategy & framework will help Banks better leverage technology, data and analytics, which in return will help retain and delight customers.

Banks can no longer live in denial and not use unstructured data for insights. They needs to realize that their competitors are proactively integrating data driven insights for decision making, thus threatening their own existence.

As the banking business becomes increasingly digitized, it has opened many doors never available before. The idea of utilizing unstructured and structured data for analysis is gaining great momentum. This will help Banks to get a holistic view of customers and build a real-time recommendation engine to predict Customers’ next moves. Insights from unstructured data like social media, chats & emails and structured data (transactional data, will help banks to better understand user needs & preferences and optimize customer engagement and services to a level which was not possible earlier.

With a few banks taking the lead, the direction is set for other banks to have robust strategy and framework to offer better customer services through gleaning unstructured data sooner rather than later.

It is just the tip of the ice berg and the possibilities are many indeed.…..

Authors:

ragsR Raghavendra (Rags)

Senior Director of Analytics, HP Analytics Data Labs

Senior Director, Hewlett Packard Analytics Data Labs. Rags have about 20 years of strong operating and commercial leadership experience in global business services, including in analytics and technology. In the last 8 years, Rags has run large analytics operations for clients in consumer industries and in solutioning analytics deals in the UK/EMEA markets for CPG and Private Equity clients. His passion is to partner with CXOs on their strategic initiatives and adding value through combination of analytics, business process solutions and change management tools. He can be reached at raghavendra.r@hp.com

RKRamakrishna Nanduri (RK)

Social Media Practice Leader, HP Analytics Data Labs

With an entrepreneurial mind-set, RK began his career in a start-up based social media company – TooStep.com (a Professional Social Networking Site). Over the last 7 years, he has worked in an advisory capacity specializing in creating social media framework & insights and was also responsible for building and developing the analytics engine, particularly in the areas of web, mobile & social media in the enterprise & consumer space. He has substantial work experience in Digital Media, Analytics, Lead Generation and Brand Building. His educational background includes an M.B.A. in (Marketing & IT) and Bachelor of Engineering in Information Technology. He can be reached at ramakrishna.nanduri@hp.com

(Visited 11 times, 11 visits today)

The post Connect With Your Customers – Unlock the Potential of Unstructured Data appeared first on Analytics India Magazine.

Lets talk about Ethics in Analytics

$
0
0

The saying goes like this, “Lies, damned lies, and statistics”. There is no doubt that statistics can be tweaked any which way to prove a point. There is a fair bit of subjectivity available in the hands of an analyst using analytics.

There are various reasons that analytics offers a scope to be exploited in hands of its users:

  1. Analytics is not an exact science, just like statistics. Two analysts can work on a single analysis to come up with widely different results.
  2. Standardization has not yet seeped into this area. There can be dozen of ways to solve of single problem with various steps to reach to conclusion.
  3. Data Scientists have to make decisions almost at every steps of analytics process. No matter how technical or ‘to-the-book’ a modeling exercise might appear, there is a fair amount of human judgment & assessment that goes into creating an analysis.

Analytics will increasingly play a significant role in the integrated and global industries today, where individual decisions of analytics professionals may impact the decision making at the highest levels unimagined years ago. There’s a substantial risk at hand incase of a wrong, misjudged model/ analysis/ statistics that can jeopardize the proper functioning of an organization.

Instruction, rules and supervisions are essential but that alone cannot prevent lapses. Given all this, it is imperative that Ethics should be deeply engrained in the analytics curriculum today. I believe, that some of the tenets of this code of ethics and standards in analytics and data science should be:

  • These ethical benchmarks should be regardless of job title, cultural differences, or local laws.
  • Places integrity of analytics profession above own interests
  • Maintains governance & standards mechanism that data scientists adhere to
  • Maintain and develop professional competence
  • Top managers create a strong culture of analytics ethics at their firms, which must filter throughout their entire analytics organization

I don’t propose the exact code of ethics for analytics professionals here; this article is merely a proposal that as an industry we require one. I regularly come across brilliant training programs being curated by industry professionals and veterans. But almost all miss any primer on code of governance, ethics, standards or even plain “how to document in analytics”.

Formal instituted ethics increases the quality of a discipline. It increases reliance and transparency, and certifies progressive long-term results with everyone’s benefits safeguarded. I believe its right time that we incorporate a code of standards in analytics that would act as a guiding star for data scientists during tough decision-makings.

(Visited 61 times, 5 visits today)

The post Lets talk about Ethics in Analytics appeared first on Analytics India Magazine.

Infosys to acquire energy consultant Noah Consulting for $70 million

$
0
0

Infosys_4C--621x414

Infosys will spent $70 million to purchase an information management consultancy that can bring next-generation data analytics to oil and gas clients. 

The $8.7-billion Bangalore, India-based outsourcing giant said its acquisition of Noah Consulting, a 122-person solution provider based in Houston, should make it possible to provide oil and gas firms around the global with end-to-end data management services covering everything from exploration to production. 

“Our oil and gas clients are adjusting to a new normal of lower oil prices,” Sanjay Purohit, executive vice president and global head of Infosys Consulting, said in a statement. “There is an urgency to improve the efficiency and effectiveness of their operations in a safe and reliable manner.”

The Infosys-Noah marriage will make it possible to use information management to integrate supply chain and financial data with operational and technical data, an industry challenge that has never been addressed effectively, according to John Ruddy, president of Noah Consulting. Clients can benefit from Noah’s deep domain expertise, proprietary methodologies and solution accelerators, the company said. 

“The upstream oil and gas industry is facing unprecedented challenges that demand faster and better ways of achieving return on investment,” Rajesh Murthy, Infosys’s executive vice president and global head of energy, communications and services, said in a statement. “With this acquisition, we are uniquely positioned to offer end-to-end data management services to oil and gas companies globally.”

Noah was founded in Houston in 2008, opened a second office in Calgary, Alberta in 2010 and hit the 100-employee threshold in 2013. The solution provider works with the super majors – Aramco, BP, Chevron, ConocoPhillips, Eni, ExxonMobil, Shell and Total – independents and oil field service companies to plan, architect and deploy information solutions. 

Noah Consulting focuses on the following areas: information management, which includes content management and data virtualization; strategic services, which includes service-line definition and value assessment; industry solutions, which includes process design and project information management; and analytics, which includes business intelligence and SAP HANA.

(Visited 26 times, 2 visits today)

The post Infosys to acquire energy consultant Noah Consulting for $70 million appeared first on Analytics India Magazine.

Top 10 Analytics Courses in India – Ranking 2015

$
0
0

Rankingannouncement_horizontal

A good data scientist should have a mix of knowledge in statistics and coding with an add-on of visualization and storytelling. There are several tools available in the market that caters to the field of analytics. To build up the right skillset it is imperative that a professional gets the right resources. It’s been our constant endeavor to bring to you the best in the field of analytics. Our Annual ranking is a step in this direction.

Through our Annual ranking we bring to you the top analytics education institutions in the country by meticulously going through the institutes and their offerings. It is a complex process based on research to get the correct information about the required parameters and then the ability to use the information to present you the right outcome.

Please note that this is a courses ranking by B-Schools in the country. We publish a separate Analytics training institutes ranking which is completely separate from this ranking. We acknowledge that slotting the training institutes with the B-School providing analytics courses in the same list is not right comparison. Thus, these are 2 separate and unique rankings. More importantly, we do not intend to rank these B-School in totality but just a specific analytics course by them.

The institutes are ranked on the following parameters:

  • Course content
  • Pedagogy
  • External collaborations
  • Faculty
  • Course Delivery/Virtual Labs
  • Placement Assistance,
  • Events etc.

This year we got more than 15 B-Schools taking part in this ranking. We take into account students as well experts feedback to carve out this cherry-picked ranking of just 10 courses.

1. Post Graduate Program in Business Analytics – Great Lakes Institute of Management

Great Lakes Chennai Campus original

The Great Lakes Business Analytics program has been created in collaboration with corporate partners and senior professionals in analytics industry. The program has delivered around 1,75,000+ learning hours and the schedule and delivery is designed keeping in mind the time constraints and learning requirements of working professionals.

IMG_1941The Great Lakes Post Graduate Program in Business Analytics equips candidates with the skill sets required for managerial, techno-functional roles in analytics. Its curriculum has been uniquely designed to meet these features and provides exposure to relevant tools like SAS, R & Tableau. The PGPBA program provides the right exposure to real world applications, ensuring that the professionals are equipped to apply their learning in the industry. The industry oriented pedagogy, hands-on exposure and highly acclaimed faculty help the candidates gain analytics competencies thereby preparing them for business and techno-functional roles in analytics.

LOCATION

The PGPBA program is currently being offered across three locations in the country: Gurgaon, Chennai, Bangalore.

IMG_1887CLASSROOM LEARNING

The program consists 230 hours of classroom sessions + 110 hours of online sessions delivered by Great Lakes faculties and industry professionals from the field of analytics. This ensures that the program imbibes Great Lakes academic elegance and industry’s business relevance, thereby providing the candidates with a remarkable learning experience.

ONLINE – LEARNING MANAGEMENT SYSTEM

All candidates have access to the online LMS that hosts content (classroom recording, discussions forums, assignments, reading material) and live webinar to enable the candidates continue their learning during off campus. The LMS provided and innovative learning environment that encourages collaborative approach between the candidates thus paving the way for maximizing learning effectiveness.

IMG_1882EXPERIENTIAL LEARNING

This program is designed to transform candidates to business ready analytics professionals through hands on experiential learning on relevant tools. This is achieved through an experiential learning format wherein participants practice exercises and assignments on software package such as SAS, R and Tableau.

CAPSTONE PROJECT

All candidates would be pursuing an industry project in the field of Business Analytics. The project is mentored and jointly evaluated by faculty from Great Lakes and Industry leaders. The project is presented to the faculty board as part of the requirement for successful completion of the program.

2. Certificate Programme on Business Analytics and Intelligence – IIM Bangalore

300px-IIM_Bangalore_Logo.svgThe course is designed to provide in-depth knowledge of handling data and Business Analytics’ tools that can be used for problem solving and decision making using real case studies.

The 1 year long duration program consists of eight modules and a project. The duration of each module is usually 5-6 days except for module 2 (2 days) and module 7 (2 days).

Students are expected to do a group project as part of this course based on a real-life problem/data. The project pre-work should start around October and should roll out by January. It will be supervised by an IIMB faculty member and must be wrapped by May with a project report submission. The Institute encourages students to publish cases studies based on their course project.

At the end of the course, the participants will be able to:

  • Understand the emergence of business analytics as a competitive strategy.
  • Understand the foundations of data science; the role of descriptive, predictive and prescriptive analytics in firms.
  • Analyze data using statistical and data mining techniques and understand relationships between the underlying business processes of an organization.
  • Learn data visualization and storytelling through data.
  • Learn decision-making tools / Operations Research techniques.
  • Use advanced analytical tools to analyse complex problems under uncertainty.
  • Manage business processes using analytical and management tools.
  • Use analytics in customer requirement analysis, general management, marketing, finance, operations and supply chain management.
  • Learn analytics through case studies published by IIMB at the Harvard Business Publishing
  • Understand sources of Big Data and the technologies and algorithms for analyzing big data for inferences. Ability to analyze unstructured data such as social media data and machine generated data.

3. Executive Program in Business Analytics (EPBA) – MISB Bocconi

MISB (1)

One of Europe’s top b-schools, SDA Bocconi, and Jigsaw Academy, launched a 10-month Executive Program in Business Analytics (EPBA) for professionals earlier this year. This was a unique combination of management principles backed by analytics training.

SDA Bocconi is currently ranked at #7 in the world for its MBA program, and Jigsaw Academy is ranked #1 in India for its analytics training courses. The program will be conducted at Bocconi University’s campus in Mumbai. Upon completion, the participants will receive certification in business analytics from the SDA Bocconi School of Management.

The course provides a deep understanding on all relevant disciplines of business analytics, including statistics, machine learning, time series, R, SAS, Big Data (Pig, Hive, Sqoop, Flume, HBASE, SPARK and Oozie), visualization, text mining, web analytics and digital marketing. In addition, it also focuses on its application across sectors and functions including Telecom, Banks, Retail, Healthcare and Insurance as well as areas such as Finance, Marketing, and Operations.

The programme involves more than 280 hours of training, including 120 hours of in-person training held over six three-day modules at the MISB Bocconi campus in Mumbai. In the interim, Jigsaw Academy also conducts 24 live online classes for a total of 60 hours, which participants can attend from any convenient location. In addition to the live online and in-person classes, participants will also have access to over 100 hours of pre-recorded video lectures on data science and big data analytics for 12 months.

4. Post Graduate Program in Business Analytics – Praxis Business School

praxisThe Praxis program is targeted at candidates who are serious about carving a career in analytics for themselves – and are willing to commit a full year to learning. These are candidates who wish to see themselves grow as successful Data Scientists. Praxis has a fairly rigorous selection process and admits only those who demonstrate strong analytical skills and an interest in numbers and problem solving.

The Course aims at equipping students with the tools, techniques and skills to enable a seamless absorption into the domain of Analytics and grow into the roles of Data Scientists. Praxis thus focuses on offering its students a comprehensive analytics experience, a deep-dive that ensures extensive coverage, rigor and hands-on lab-work.

Pedagogy

Business Analytics lies at the intersection of three key disciplines, namely Statistics, Programming and the targeted Business Domain and the 9 month program at Praxis is designed to address all three in significant depth.

The backbone of analytics is the theory of statistics in general and data mining in particular and these two key areas as two different subjects across two consecutive semesters to ensure that students have the time to imbibe and absorb the nuances of theory and have a strong foundation to build upon. Both these subjects have ‘lab’ sessions where the students use R to actually try out the theory on the basis of publicly available datasets.

5. Post Graduate Program In Business Analytics & Big Data – Aegis Aschool of Business

aegis logoPost Graduate Program In Business Analytics & Big Data brings together the current software content, real-world industry experiences, hands on exposure on various Big Data tools at Big Data Product Factory & IBM Business Analytics and Cloud Computing Lab for the participants.

The course curriculum is designed & developed by IBM’s designated subject matter experts & Industry experts for the participants & data science enthusiasts that is jointly delivered by IBM’s subject matter experts and & Industry experts.

The curriculum caters to the various skill requirements of organizations across the world including eCommerce, Telecom, Banking, Computer Services, Education, Healthcare, Insurance, Manufacturing, Retail, Automobile etc.

A wide range of core and elective courses provides the participants the freedom to design the program suiting to their and industry needs.

External Collaborations:

In 2015 Aegis has joined hands with IBM to offer high end courses in the field of Business Anlytics, Big Data, Cloud Computing and Mobility.

IBM and Aegis have collaborated to setup an IBM Business Analytics and IBM Cloud Computing Lab in MTNL’s world-class infrastructure in Powai, Mumbai, to help students and faculty members to enhance their skills in areas of Business Anlytics, Big Data, Cloud Computing and Mobility.

MTNl, a leading Govt of Indian telecom service provider, is Aegis Infrastructure partner in Mumbai.

Aegis’ Post Graduate Program in Business Analytics and Big Data, PGP (BA & BB) is India’s first high end data science program designed and delivered by Aegis School of Business & Telecommunication in association with IBM to train the new generation of data-savvy professionals.

6. Post Graduate Certificate in Predictive Business Analytics – Bridge School of Management

bridgesomBRIDGE School of Management is a flagship business school launched via a joint venture between HT Media Ltd. & Apollo Global, Inc. (USA). Apollo Global (www.apolloglobal.us) is one of the world’s leading higher education providing companies.

The certificate program has been specially created for India by academicians from Northwestern University and top industry experts using real-world problems and situations. The Northwestern and Bridge School initiative combines online content developed and taught by Northwestern faculty with weekly in-person sessions led by local specialist faculty at the Bridge School’s learning centers.

Program Objectives

  1. Apply analytics tools to real-world business contexts for improved decision making
  2. Assess the strengths and limitations of analytics and predictive modeling techniques for different business applications and varying data conditions
  3. Acquire hands-on experience working with leading statistical tools and software packages (such as R) in predictive modeling and the visual analysis of results
  4. Effectively communicate the actionable insights stemming from analytical work to multiple stakeholders
  5. Strategically navigate technology tools and trends to solve big data and analytics problems
  6. Manage data strategies and analytical projects.

7. Certificate Program in Big Data and Analytics (BDAP) – SP Jain School of Global Management

sp jainThe course is being offered at S P Jain’s spanking new campus at Lower Parel, which boasts of State of the art facilities, in the heart of the city’s business center.

BDAP is designed to explore, analyze and unravel the complex, unstructured data-driven world. The program kicks of with 10 core courses that build a strong foundation for the second stage of the program, which incorporates more in-depth and application-based learning. Given the need for specialist knowledge, it provides a range of courses in topics like data mining, machine learning, visualization techniques, predictive modeling, and statistics.

The programme content builds on basic concepts, teaches tools and technologies that are currently prevalent in industry and progresses to cutting edge-topics like machine learning and Natural Language Processing.

On completion of the program students would have learned to apply quantitative modeling and data analysis techniques to solve real world business problems, successfully present results using data visualization techniques, demonstrate knowledge of statistical data analysis techniques utilized in business decision-making, apply principles of Data Science to the analysis of business problems, use data mining software to solve real-world problems and employ cutting edge tools and technologies to analyze Big Data.

The program is delivered by a faculty that is an equal mix of academicians and industry practitioners with a key proportion of overseas instructors thus lending the course a global perspective.

8. 2-year Full time PGDM Programme with Analytics Specialization – Narsee Monjee Institute of Management Studies

narsee monjeeNMIMS, Bangalore offers industry leading specialization in Analytics for its PGDM programme. Students in the second year of the programme can opt for this specialization. It also offers Marketing, Finance, Operations and HR as other specializations. The second batch of this specialization is running now. The first batch was well received by industry and the students are absorbed in organizations like Citibank, Infosys, mu-sigma, GENPACT, iGate, Netapp, Fidelity etc.

Through this specialization, NMIMS trying to educate Analytics professionals who are well equipped with Management functions and Data Science. The coverage of the specialization is extensive as it got Tools, Techniques, Functional and Industry related courses.

Course Content

The Analytics specialization stream consists of twelve (12) courses (and a workshop) spread across 3 trimesters in the 2nd year of the PGDM program. It is expected to cover the knowledge areas expected of an Analytics professional viz. tools, techniques and functions. Additionally, a course titled ‘Business Analytics for Decision Making’ is compulsory for all students in the institute.

Pedagogy

The programme is conducted live in the class room at the campus at Bangalore. The delivery consists of classroom lectures and interactions, case discussions, workshops and analysis of live industry problems. The institute got license to SAS software and hence, most of the data analysis and modelling is conducted on this platform.

9. Executive Program in Business Analytics and Business Intelligence – IIM Ranchi

IIM ranchi“Executive Program in business analytics and business intelligence (Saturday to next Sunday with one week leave)” is specially designed to provide inputs which will equip the participants with analytical tools and prepare them for corporate roles in analytics-based consulting.

These inputs will provide a basis for the participants to channelize their analytical thinking in appropriate directions, besides, enhancing knowledge. The skills so acquired may be effectively utilized in their day-to-day work and thereby promoting the quality of business decisions.

Objectives of the Programme

  1. To enable the participants to understand and use the tools and techniques for business analytics and business intelligence.
  2. To enable the participants to make use of large volume of data for meaningful business decisions and strategy
  3. To impart hands-on-experience with various softwares, like, (i) R, (ii) SAS (iii) Python (iv) SPSS

Pedagogy of the Programme

The participants will learn the concepts and implications of business analytics & business intelligence through class room lectures, interactive discussions, case studies and hands-on-experience. Both conceptual and practical sides will be addressed.

Participants Profile

The course is suitable for those with analytical aptitude and would like to start new career in analytics. The course is also appropriate for those who are working in business analytics and business intelligence to enhance their knowledge and skill.

10. PGDM with Specialization in Business Intelligence and Big data – IMT Ghaziabad

imt_logoThis is a unique course which prepares you for the world of work in analytics in companies. Students having opted for this course in the previous years have found placement offers from leading companies, the designations include Data analyst, Business development Manager, and Business Analyst and research analyst. The course gives you a blend of industry knowledge, concepts and experiential learning through collaborative teaching by industry experts. Take the first step in joining the course; we will then help you to complete the journey into a person well-versed with the art and science of analytics.

Pedagogy

The pedagogy will be a mix of lectures, experience sharing, real life case discussion, assignments and industry/research based projects. The course is focused on strategic issues with cases as the primary vehicle for learning. In addition to the reading materials, additional readings and cases will be distributed in the class from time to time. Students are also expected to prepare and analyze all the cases as class participation is very important. There are four main pillars in the course pedagogy, namely, (a) lectures-cum-PPTs to share the conceptual frameworks; (b) experience sharing through collaborative teaching by industry experts; (c) hands-on Statistica Data mining tools, computer-lab based; and (d) case studies of leading organizations selected from Harvard Cases and other sources. The course requires a high degree of interactions in the class on part of the students and feedback on their hands-on work is provided by industry experts.

View & Download the complete report on Slideshare

Top 10 Analytics Courses in India 2015
Title: Top 10 Analytics Courses in India 2015 (18 clicks)
Caption:
Filename: top-10-analytics-courses-in-india-2015.pdf
Size: 3 MB

Note: There is a poll embedded within this post, please visit the site to participate in this post's poll.
(Visited 1,714 times, 704 visits today)

The post Top 10 Analytics Courses in India – Ranking 2015 appeared first on Analytics India Magazine.

Significance of Data and Analytics in Online Education

$
0
0

Irrespective of which niche you talk, data analysis has emerged out to be one of the most important factors that define the growth and development figures. In order to define data and analytics in the simplest possible words, this is one of those keys that can open the doors to any problem associated with your business. With the certain modifications going on in the educational trends, the online education is making its presence felt across all pavements. Be it the normal management courses or the professional degree courses, with the ease of everything available over the internet in the form of online education, the accessibility has improved to a great level. In spite of all the sides, less has been talked about data and analytics in context to the online education. However it can be truly proved that data and analytics have been very helpful for the growth of online education where it is today.

The streams like data and analytics have extensively affected the present online education system. In the recent few years, many new and old globally acclaimed universities have come up with their online courses as well. The main reason behind this has been due to the acceptance of these courses amongst students. Now with the freedom of studying anything from any place, students have started to heavily rely on the online learning system. If you take a look at the figures, they clearly state that the percentage of students opting for these courses is increasing at a tremendous rate. This is a clear example of how significant the data and analytics are, in terms of online education industry.

Since the basic computer knowledge and a working internet connection is the only requirement that students needs to study online, it is opening up as a virtual education platform even for those who never thought of studying beyond a certain level. As per the reports from the major surveys, it can be believed that in the coming 5 years, this market is expected to grow by 50 percent. In addition to this, it is only due to the industry analysis that many big and established players of traditional education systems are stepping into the online education industry and trying to capture as much market as they can in the mere beginning years. Be it simple language learning tutorials or courses as complex as the MBA and PGDs, students are choosing the online learning platforms over the traditional ones in big numbers.

Each and every study that is being done in this field is becoming possible only due to the data analysis and analytics. Apart from simply increasing the popularity of these courses, the data and analytics over the internet have greatly helping in reducing the real time in assessing the students’ performance and grading them. Considering all the aspects discussed above and catered in various reports, it can be clearly realized the online/distance education system has grown and driven to this level with the effective use of data analysis and surveys that have been done. The insights clearly show that the data and analytics have and will always hold major significance in the strategic growth of online education.

(Visited 21 times, 21 visits today)

The post Significance of Data and Analytics in Online Education appeared first on Analytics India Magazine.

Accelerate Value Extraction from Big Data Systems

$
0
0

Direct customer relationships are a privilege, but they also generate massive amounts of data. This wealth of information holds the potential to drive real frontline differentiation, if retailers have the right tools and approaches to make the most of this unique asset ‘Big Data’.  In our experience of working with retailers across the globe, we have found Big Data to be getting a lot of interest, but most retailers struggle with some common challenges such as how to align big data with business decisions, how to identify new types of data and how to gather big data for improved decision making.

So, What should one do to leverage this so called Big Data?

  1. Get your house in order: With retailers it is possible that customer data and transaction databases are disparate first order of business would be to harmonize these. Invest in a good big data system. Azure or HP Vertica are all viable options.
  1. Know your customers: Do you have all the information about your consumers in your own database? Is there value in evaluating 3rd party data sources to enrich what resides inhouse?
  1. Invest in a good social listening tool: The adage ‘action speaks louder than words’ no longer rings true for most part in this age of social media. Can go from a 140-character rant to a rambling tirade. Pick your Poison. It is important to be aware of where one stands in social media. Can have long standing impact on your brand and consequently on the topline and the bottom-line.
  1. Use data and decision engineers: All this big data will necessitate folks that can enable you to use the data efficiently. Data engineers are essential to maintain your big data ecosystem and decision engineers will be able to derive maximum information from the data. Be it basic EDA or complicated machine learning algorithms. The larger question is whether to nurture this talent in house or partner with a analytics service provider. The size of your operation will answer this question best. No matter what the right answer is, it is best to get started with an experienced analytics service provider.
  1. Optimize your supply chain, distribution and campaign: Having all of the above in place will enable one to derive most from big data. For retailers with conventional storefronts, machine-learning algorithms can

Identify your most popular product based on legacy data, integrating POS data will help inform your supply chain – identify SKUs that are likely to be most on demand and adjust/plan production accordingly and also adjust distribution. Being able to aggregate data as close to real time as possible will also enable smarter campaign planning and management. All of which will ensure that your feet are firmly planted in black.

To compete in a consumer-empowered economy, it is increasingly clear that retailers must leverage their information assets to gain a comprehensive understanding of markets, customers, products, distribution locations, competitors, employees and more.

(Visited 11 times, 11 visits today)

The post Accelerate Value Extraction from Big Data Systems appeared first on Analytics India Magazine.


Webinar on HR Analytics [29th Oct’15]

$
0
0

google

Imarticus Learning, in conjunction with KPMG India, brings to you a complimentary webinar on how using and understanding HR analytics can be vital in moving a business forward.

Agenda for the Webinar:

Making HR a strategic partner to business

  • Aligning HR with business drivers
  • Scientific approach and clear MIS
  • The HR practitioner of the future

Case Example: Employee Attrition

  • Defining the problem
  • Data – Collection, Validation, Enhancement
  • Modeling
  • Insights
  • Implementation

Taking a holistic approach

  • Linking people investments to organizational outcomes
  • Improving skills, efficiencies and retention

Implementing HR Analytics

  • Who owns analytics
  • Involvement of HR
  • Capabilities required of HR
  • Where analytics should sit structurally
  • Implementation to ensure Analytics becomes a part of life

Ideal For:

  • CXO: Analytical approach to organization development
  • HR Professionals: Implementing Analytics within the HR function
  • Team Managers -Operations, Finance, Marketing, Etc.: Building & managing teams using an predictive analytics

Speaker:

Amit Mathur
Amit is an Associate Director in the Analytics practice with KPMG India. Prior to joining KPMG Amit was the Delivery Lead for Absolutdata, a niche analytics firm, for their largest client with billings of over $2 million.

Some of the other organizations that he has been associated with include GE Money India, TD Bank Group Canada and US, GE Consumer Finance Americas, British Gas, Accredited Home Lenders, US, HDFC Bank etc. He has also been active in propogating the cause of analytics in industry forums, including a special even organized my Chartered Management Institute (CMI) in Colombo, Sri Lanka and a special event conducted by on the Role of the CAO done by CMR advisors in Mumbai.

Registration Process:

To participate in the webinar, simply click on the following link. We will get back to you with the instructions along with a link to access the webinar.

Complimentary Webinar Registration

Date: 29th October 2015 (Thursday)

Time: 4:00 pm to 7:00 pm

About Imarticus

Imarticus has been formed to bridge the gap between academia and the industry by providing knowledge and skill sets which are essential in today’s competitive working environment.

Offering comprehensive industry specific training programs in various sectors such as Analytics, Information Technology & Financial Services, Imarticus Learning aims to elevate the skills of professionals aspiring to upgrade their profiles or begin their career, thereby increasing their employability and relevance to the industry at large. 

www.imarticus.org

About KPMG

KPMG was established in India in September 1993, and has rapidly built a significant competitive presence in the country. The firm operates from its offices in Mumbai, Pune, Delhi, Kolkata, Chennai, Bangalore, Hyderabad, Kochi, Chandigarh and Ahmedabad, and offers its clients a full range of services, including financial and business advisory, tax and regulatory, and risk advisory services.

In India, KPMG has a client base of over 2700 companies. The firm’s global approach to service delivery helps provide value-added services to clients. The firm serves leading information technology companies and has a strong presence in the financial services sector in India while serving a number of market leaders in other industry segments.

(Visited 17 times, 17 visits today)

The post Webinar on HR Analytics [29th Oct’15] appeared first on Analytics India Magazine.

Interview – Bibek Banerjee, Dean at BRIDGE School of Management

$
0
0

bibek interview

Acclaimed institution builder in India, Dr. Bibek Banerjee joins BRIDGE School from the Institute of Management Technology Ghaziabad, where he was the Director and Academic Mentor of Group-IMT (India). Previously, he had spent 18 years of his academic career as Professor of Marketing & Economics at the Indian Institute of Management Ahmedabad (IIMA).

In this Q&A, Dean Banerjee shares his vision for BRIDGE SCHOOL as an “Analytics Education Center of Excellence”.

Analytics India Magazine: Hello Professor Banerjee! You have just joined BRIDGE School of Management recently.  How do you foresee BRIDGE’s role in continuous education for working professionals in India?

Bibek Banerjee: BRIDGE School of Management is uniquely positioned on connecting education to industry and professional practice. With its world class resource base and deep global experience in the space of professional education, I believe Bridge School is at a position to enable full realization of the talent potential that would serve the needs of the industry.

There are several facets of BRIDGE School that are compelling value propositions: both for employers as wells as for the professional workforce.

One, it is focused on RELEVANCE. Every program that BRIDGE offers is co-created with the industry, keeping their needs in mind, allowing us to be lean and business-like in our program delivery.

Two, our EDUCATORS are a mix of practicing professionals and hand-picked academicians. This ensures that theory is always actioned with practicalities of running businesses in every aspect of our program delivery.

bridge1Three, high ROI in terms of LEARNING OUTCOMES due to our unique and versatile blended pedagogy of face-to-face interaction coupled with online engagement which gives personalized services to the learners

Four, our collaboration with some of the best professional universities of the world allows us to access and adapt the BEST-IN-CLASS programs very quickly. Northwestern University is among the top schools of the world, and with them we ensure that what we teach in our classes meets the highest quality standards, not just for today’s needs, but for the needs of the industry in the future.

AIM: What can BRIDGE offer, in the Analytics and executive management education that other universities/ institutes can’t? What are the competitive advantages for your students and graduates?

BB:

  1. We are strategically positioned close to the industry – both physically as well as intellectually. Our two pilot centers: Cyber City Gurgaon, and Noida; are embedded among the corporate offices of most large and medium organizations.
  2. Our resource base comprising of a wide variety of professional courses, workshops, simulators, business games and interactive e-libraries is truly world class. We are able to build this as we can leverage our collaborators from the best across the world. Like Northwestern University, home to the famous Kellogg School of Business.
  3. We have customized our Analytics programs, from Marketing to Risk, catering to industry needs in India based on inputs from leading organizations, subject matter experts and industry associations.
  4. Tangible take-aways that are relevant, comprehensible and transparent are provided to our students. We usually minimize the abstract and maximize the practical skills and competencies needed to successfully affect the next turning point in their career.
  5. bridge2Let me also point out that as our faculty comprises senior leaders from leading organizations, they help learners relate real corporate situations and case studies with theory as they are equipped to teach practical and relevant applicable skills in the weekend sessions.
  6. We have empanelled over 30 organizations based in Delhi NCR across consulting, e-commerce, telecom, IT, BFSI only for the analytics opportunities. Furthermore, we offer career services for our students who seek greener opportunities. Our consultants work individually with students to provide opportunities to them in successfully unlocking their potential.

AIM: Can you share some light on the Analytics programs structure, content & pedagogy offered by BRIDGE?

BB: 

  1. The Certificate in Predictive Business Analytics is a 40 weeks program.  A successful completion of the program will earn aspirants the coveted certification in Predictive Business Analytics from Northwestern University (SPS) & BRIDGE School of Management. This program has been adapted from Northwestern’s MSPA degree program.
  2. The Advanced Certificate in Analytics is an 8 week long program. After completing the Certificate in Predictive Business Analytics, students may continue their education and earn an advanced certificate in one or more of the following areas:

bridge3I.Marketing and Web Analytics (Joint Certification by Bridge & Northwestern )

II.Risk Analytics ( Joint Certification by Bridge & Northwestern )

III.Supply Chain Analytics( Joint Certification by Bridge & Northwestern )

IV.SAS Analytics* (Certification by Bridge)

  1. For fresh graduates, (0- 11 months of work experience), the Certificate in Predictive Business Analytics includes specialization and internship in a 58 week long program.
  2. BRIDGE Online’s Data Analytics program offers a foundation program in data sciences with courses in database fundamentals including Core Database Concepts, Data Storage, Relational databases, Manipulating Data and Administering Databases.

Northwestern University’s CANVAS online learning environment provides an innovative learning platform that encourages collaborative approach between the candidates. Weekend Programs delivered by Senior Practitioner Faculty (CEOs/VPs from leading organizations) help employees relate real corporate situations and case studies with theory. Complementing them is a panel of the best-in-class Indian and foreign academicians.  Click here to apply online http://goo.gl/GIObDd

AIM: As an institute focused on Analytics and executive management education, have you established close links with industry?  What are BRIDGE’s strengths with regard to linking education to industry?

BB: BRIDGE School’s curriculum has been created by a highly qualified academia with inputs from senior industry leaders to address the needs and demands of the industry.

These programs have been created with inputs from leaders of large corporations as well as industry associations such as the Society for Human Resource Management (SHRM), and the National Association of Software and Services Companies (NASSCOM).

bridge4Each of our programs is led by a Council composed of a Program Chair, academicians with domain expertise, Functional and HR Heads from large Indian and international corporates. This team manages the program in terms of its design, project flow, case studies and lecture-demonstrations, soft skills workshops and delivery structure of specific elements of the various courses. This team is also engaged in periodically reviewing each program in terms of its quality – and initiate appropriate measures to continually improve the programs.

For example this year we are working with TiE members to organize live analytics projects and Case Contests for Bridge students; as well as a few mentorship engagements – this way BRIDGE students get unparalleled exposure to subjects that are current and stay abreast of the dynamical changes in the discipline in practice.

AIM: Describe your vision, going forward, for BRIDGE School of Management as an “Analytics Education Center of Excellence.”.

bridge5BB: The academia and industry has lamented endlessly about the lack of co-created value. My vision for BRIDGE school is to build that missing-BRIDGE, in collaboration with industry partners and the academe. I am excited that at Bridge, we have the opportunity and the resource base to truly customize education programs that would be relevant to the needs of the executives and the employers, for today’s context and most importantly, for the foreseeable future.

My goal is to create a portfolio of innovative programs providing world class knowledge, expertise and learning experience for our biggest stakeholder – the young and aspiring professionals who need continuing up-gradation of their skill sets and leadership capabilities to succeed in their lives.

(Visited 88 times, 29 visits today)

The post Interview – Bibek Banerjee, Dean at BRIDGE School of Management appeared first on Analytics India Magazine.

Technology Persuasion – How Design Thinking and Advanced Analytics can combine to deliver Superior Customer Experience

$
0
0

Every time I am away from LinkedIn for more than 2-3 days I get an innocuous looking message, which runs something like –“You’re getting noticed. See who all have accessed your profile in the last few days.” Invariably it gets me intrigued. Who are these wonderful people who are viewing my profile? [let’s face it – there are 2 types of people in the world. The wonderful kind who want to find about more about us and the other kind who don’t careJ] More often than not I will click on the message, which directly opens the App on my smartphone. Once in, the App not only provides who all have viewed my profile but only ‘how’ they stumbled on my profile and also how I rank in the ‘page views’ etc. Most times I will also review some of the latest updates and content on the App itself. Though I haven’t timed myself I would say I spend about 7-10 minutes on each visit.[1]

Though it sounds simple a lot is actually happening to make me spend those 7 minutes! First I am being ‘prodded’ to view the App. Second once I am in the App is providing ‘personalized’ insights which I may care about and finally it is persuading me (ever so gently!) to delve deeper and spend more time in reviewing the latest content which I might have missed.

LinkedIn has had to combine behavioral engineering, design thinking and big data technology to create this addictive behavior in me [in fact there is evidence to suggest that habit formation and addiction may have a similar path formation in the brain[2][3]]. Although ‘customer habit formation’ lies at the heart of most successful enterprises, technology companies have the greatest access to the customer data and context have the capability of taking this create unique experience at an individual transaction level.

This is perhaps best understood as a 4 step cyclical process as shown in figure below. 2


Four Step Process of ‘hook’ used for Customer Habit Formation2

In our example the trigger was the enticing message, which induced us to take an action, viz. – open the App. The third step was the critical component of the personalized, contextual insights. Why does it need to be unpredictable? The answer lies in the brains pleasure centers, which are more ‘turned on’ when we experience unpredictable pleasant things compared to expected pleasant events.[4] Finally, I am propelled to investment, which includes maybe responding to an invite, reviewing new content etc.

Analytics can play a critical role in ensuring a more effective ‘hook’ for more customers. The cycle hinges on customer being ensured of a ‘personalized, unpredictable, pleasant reward.’ Analytics can utilize available customer data to create personalized offers based on past sales, demographics and search patterns (for example).

Design is the other cog of this cycle. Organizations need to envisage a ‘Customer Journey Map’, which covers all four aspects covered above. What complicates the situation further is the choice available to the customer in terms of competition, multiple channels, variable interest levels etc. Design thinking can help organizations in designing seamless, intuitive and unique experience for the customer thereby creating a powerful habit forming cycle.

Although the discussion above may seem relevant for technology companies today as we move into the ‘connected economy’ companies are going to access to more and more of the customer data. Think of your utility providers, for example. In the next 5-7 years as ‘smart meters’ get ubiquitous they will be privy to a massive amount of customer usage data. Both B2B and B2C companies will therefore need to invest in enhancing design and embedding analytics into their customer’s processes to ensure greater stickiness and profitability.

Disclaimer: These are the personal opinions of the author and not those of IBM.

[1] Disclaimer – LinkedIn is purely for illustrative purposes. It is not to suggest that it is in any way superior to competitors.

[2] http://www.ncbi.nlm.nih.gov/pmc/articles/PMC2891067/

[3] http://www.technologyreview.com/news/535906/compulsive-behavior-sells/

[4] http://abcnews.go.com/Health/story?id=116829&page=1

(Visited 24 times, 26 visits today)

The post Technology Persuasion – How Design Thinking and Advanced Analytics can combine to deliver Superior Customer Experience appeared first on Analytics India Magazine.

Infographic: Application of Big Data in 10 Industry Verticals

$
0
0

The ever-increasing demands of the markets have forced the Industries to re-evaluate strategies and focus on innovative practices to stay ahead of their competitors. Purpose of every business is to identify and solve problems of their target markets. But the irregularity in requirements makes the process a little difficult and that’s where Big Data plays a key role. Helping Industries solve problems through analysis of huge amount of data is where Big Data plays a key role.

Over time, it has created quite an impact in a number of Industries and continues to prove its worth as we speak. This infographic highlights a few examples of how applications of big data is being utilized by Industries in solving their problems. Industries, apart from the confidence to take a dip down the Big data ocean, also have a lot of constraints. The biggest of them all is the funding regarding projects involving Big Data. Certain Industry sections are still hesitant or are not that excited to consider Big Data as a worthy investment option. Yet, the number of adopters are also not far behind. Through this Infographic, you’ll get an idea as to how diversified sectors are considering investments in Big Data to further their businesses.

Applications_of_big_data_infographic

(Visited 35 times, 1 visits today)

The post Infographic: Application of Big Data in 10 Industry Verticals appeared first on Analytics India Magazine.

From Confusion to Clarity – Global Healthcare Data Trends and Challenges

$
0
0

Healthcare organizations are, or will soon be, producing petabytes of valuable data from their financial, clinical and business systems. But the ability to transform these massive data sets into actionable insights requires business intelligence (BI) and analytics tools that can uncover the hidden relationships among varied sources of information, provide rich visualizations of trends and don’t require end-users to be trained data scientists.

Qlik, a leader in visual analytics serving 36,000 customers around the world across all major industries, recently partnered with HIMSS Analytics to undertake a global study of the use of BI and analytics in healthcare. The goal — to provide healthcare professionals with insight into how their colleagues leverage analytics today, and the common barriers they face in gaining meaningful insights from the data they produce.

The findings suggest that the future of healthcare analytics is both promising and challenging. Early adopters report that the right business intelligence tools — in the right hands — can improve individual patient care, reduce healthcare costs significantly, meet reporting requirements and drive new opportunities to enhance population health. But this study also shows that many healthcare providers have just scratched the surface when it comes to unlocking the inherent value of their data. They recognize this and   are looking for new ways to generate greater insights and value.

About the study

The study was fielded in August and September 2015 and surveyed more than 400 C-suite, vice president and director level contacts from clinical, financial, operational, technological and executive areas of expertise.

Respondents included healthcare providers from North American, European and Asia Pacific countries.

For the purposes of the study, a BI or analytics solution was defined as a solution that identifies, extracts and analyzes business data (such as revenue by department) to support business decision making, and clinical data (such as patient readmission rates or lab results) to support healthcare decision-making. Among all respondents, 55.7 percent reported having implemented such a solution, while 32.7 percent had not. The remaining 11.6 percent were unsure.1 Four key areas were then explored: (1) the level of maturity across a variety of use cases; (2) the value that has been realized from current initiatives; (3) the challenges experienced by providers as they seek to implement analytics in their organizations; and (4) future investment plans in healthcare analytics.

Among the high-level takeaways is that while many healthcare leaders have stuck their toes in the water, relatively few have begun to exploit the full power of BI and analytics. “It certainly is not mature,” observed John Hoyt, Executive Vice President, HIMSS Analytics. “I would say it is developing… It has some mature clients, but those tend to be the bigger integrated delivery networks.”

Maturity and value

Overall, the study found that the maturity level for most use cases of BI and analytics is relatively moderate. But as is often the case, generalizing can obscure important truths.

“While analytics is front and center in healthcare, maturity can vary by solution areas — driven in large part by local and regional pressures,” explained David Bolton, Qlik’s Global Director for Industry Solutions in Government and Healthcare.

Not surprisingly, then, the survey found that the most mature BI use cases for US respondents include   meaningful use, reducing the average length of stay and clinical benchmarking — all priorities that are being driven by the Accountable Care Act. Here, insights that combine data from multiple sources can really make a difference. For example, an academic medical center in Kentucky   used visual analytics to identify clinical variations that, in turn, impacted bed nights. By emphasizing best practices   to outliers, the hospital not only reduced its average length of stay, but also improved patient-satisfaction scores.

Other uses for BI with mature statuses for US respondents included readmissions and OR/ER utilization rates, for which two-thirds of the respondents described their efforts as “advanced” or “moderate.” Meanwhile, a little more than half described their supply-chain analytics use as “moderate” or better. Here, Bolton sees an opportunity for quick wins in spend analytics.

“In England, a group of National Health Service organizations combined in a procurement hub,” he said. “Using analytics, over two years they were able to identify and save more than $40 million.”

Perhaps the flip side of spend analytics is BI designed to achieve cost savings. Most survey respondents cited that   as their top BI/analytics benefit. In fact, saving money led the list of benefits cited for clinical, operations and financial experts. Technologists rated “faster and more accurate decision-making” as their top benefit, while executives said “increased internal transparency” represented their highest benefit.

Hoyt isn’t surprised that clinicians, operations and financial experts agree that BI and analytics implementations can drive significant savings. “The BI benefits are in quality improvements and driving out waste,” Hoyt said, “and often, improving quality reduces unnecessary cost.”

Other frequently cited benefits in the study include, by area of expertise:

  • Clinical – workflow efficiencies, chronic disease management, faster and more accurate decision-making;
  • Operations – supply efficiencies and increased transparency (related to staffing levels);
  • Finance – faster and more accurate decisions and reductions in A/R days;
  • Technology – reduction in tech infrastructure and infrastructure cost: easier integration of disparate data sources;
  • Executive – operational, clinical and financial efficiencies.

Challenges

Given the value and opportunities presented by BI, the study sought to understand why adoption and maturity weren’t more advanced. In part, Hoyt argued, it is a matter of definition: If you’re not using a dedicated analytics tool, some might ask, are you really doing analytics, or something else? Some healthcare organizations — especially smaller ones — struggle with the cost of advanced solutions but still use spreadsheets and manual processes to analyze data.

Other organizations are using the historical approach, where decision-makers request tables and number- crunchers produce them, often in PDF format with weeks- old or even months-old data.

In contrast, contemporary BI and analytics tools can provide real-time, query-able data and are simple enough for self-service. “It changes the decision-making process,” said Bolton. “It doesn’t just speed it up. It creates greater confidence in decisions.”

Aside from the definitional issues, respondents offer a long list of challenges they faced during their BI deployment.

The most frequent was end-user adoption, followed by limitations of dashboard capabilities, variations in data quality, clinical workflow integration and data aggregation. And then there’s cultural resistance. “Physicians may say, ‘We’re not data scientists, just tell us the results,’” said Bolton. “But visual analytics turns that on its head. You get the data when you want it, you get what you want and you can ask questions of it. You don’t need to be a data scientist.”

Top 4 Challenges in Realizing the Full Potential of BI/analytics Solutions

Screen Shot 2015-10-29 at 4.33.02 PM

Future investments

So what does the immediate future hold for business intelligence and analytics? In the United States,

the top BI priority over the next 12 to 24 months is the ICD-10 transition. That is followed by population health management and integrating analytics with existing solutions.

Among global respondents, BI and analytics dashboard development was the most reported investment priority in the next 12 to 24 months, followed by BI/analytics integration with existing solutions.

Given the potential return on data that healthcare organizations are already producing, the study suggests both continuity and change in healthcare analytics: continuing investment in new tools that can simplify data analysis for end-users, and ongoing changes in maturity and applications.

Investment Priorities for BI/Analytics – International vs. United States

Screen Shot 2015-10-29 at 4.37.04 PM

Summary

The results of the study offer actionable insight for healthcare providers seeking to implement business intelligence and visual analytics solutions. As the study suggests, while many have identified specific use cases for proof points and tactical wins, further value can be gained by maintaining a long-term strategy that provides intuitive self-service solutions that ensure end-user adoption.

1 Respondents from larger U.S.-based healthcare providers were more likely to report the use of BI/Analytics solutions.

About Qlik:

Qlik is a leader in visual analytics. Its portfolio of products meets customers’ growing needs from reporting and self- service visual analysis to guided, embedded and custom analytics. Approximately 36, 000 customers rely on Qlik solutions to gain meaning out of information from varied sources, exploring the hidden relationships within data that lead to insights that ignite good ideas. Headquartered in Radnor, Pennsylvania, Qlik has offices around the world     with more than 1700 partners covering more than 100 countries. www.qlik.com.

(Visited 20 times, 6 visits today)

The post From Confusion to Clarity – Global Healthcare Data Trends and Challenges appeared first on Analytics India Magazine.

Viewing all 17771 articles
Browse latest View live


Latest Images