 Organized Retail has exploded in the last decade. To keep pace with changing industry dynamics, consumer’s evolving needs, and a highly competitive landscape; Retailers need to constantly evolve and adapt themselves to new trends.
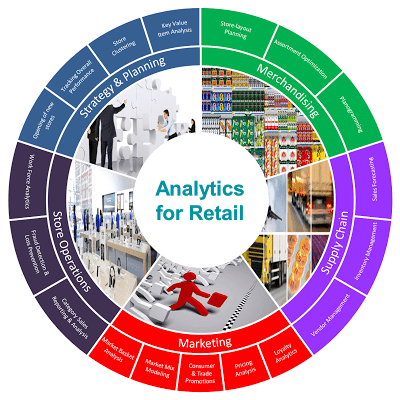
Marketelligent partners with Retailers in making faster and more informed business decisions using our realm of analytics capabilities that pans through different functions and teams.
Store-layout Planning
Effective macro space planning is critical for consumers to have a favourable perception about the store’s environment and to increase sales throughput. Store layout planning shows the size and location of each department, permanent structures, fixture locations, merchandizing and overall aesthetics in order to maximise revenue, increase consumer footfalls and conversion rates.
Store layout includes category space allocations and adjacencies in order to optimize overall sales and footfalls.
It helps in answering business questions like:
- Which departments will produce the highest traffic? Which departments should be placed adjacent?
- Where different departments should be spaced to facilitate the deepest penetration and widest dispersion of consumer flow throughout the store?
- Where different categories should be placed so as to have maximum impact on consumers?
- Where the seasonal items should be placed?
Assortment Optimization and Planogramming
Different products and SKUs within a category are assorted based on their profit and revenue contribution and local consumer preferences. It can be assorted for a store cluster or localized at an individual store level. Dividing the products into—core/destination (drive the store sales), complementary/accessory (add-on items for core products), secondary items (not core, but have the potential to develop over time) and impulse items—also serves as the basis for assortment.
Once the right assortment has been decided for each category, the next logical step is placing them in the most effective manner on the shelf. Planogramming is a widely used technique for the same. It enables the retailers to stock the product, at the right place, at the right time, with the right facing to attract the consumers and prompt them to buy.
Sales Forecasting
A good demand forecast helps improve sales volume, cash flow and hence the profitability, by optimizing inventory and by minimizing out-of-stock. Besides considering historical data, external factors like changing trends and consumer preferences, seasonal impact and promotion influences on demand, price changes, different store formats and channels are also considered for more accurate forecasts. Sales forecast in retail is very essential for:
- Stock replenishment by categories and SKUs
- Predicting excess and stock-outs at SKU level and hence minimizing costs
- Designing store promotion activities and optimizing resource allocation for the same
- Capitalizing on peak sales weeks: Accurate forecasting ensures right product mix to take full advantage of operational capacity and peak market demands
Statistical techniques (like Moving averages, Holt Winters, Regression, ARIMA, etc.) are employed to project future demand on a category and SKU level, based on historical data.
Inventory Management
Optimal inventory management is an indispensable function to ensure un-interrupted product supply to meet the consumer demand. Stock out analysis on a category and SKU level helps in:
- Optimizing inventory and service levels by streamlining ordering processes
- Minimizing stock out which leads to loss of sales
- Handling overstock which results in increased inventory handling costs and cost to liquidate the excess inventory
- Maximizing warehouse space utilization
- Designing store promotion activities and optimizing resource allocation
Concepts of lead-time and re-order point are utilized for inventory planning. Lead time is the time lag at which order is placed to the point at which stocks are available. The buffer quantity to cover any unplanned excess requirement, taking into account delivery delays, is referred to as safety stock. Providing for safety stock, on top of lead time demand, will give the re-order point, which is the minimal level of stock at which procurement should be triggered. Warehouse stock should never go below the re-order point. Re-order point will assist in deciding what would be the optimal order quantity and when to place an order.
Vendor Management
For the efficient and smooth functioning of a retail store, various departments have to work in tandem. Mostly these day to day operations are outsourced to vendors. Constant monitoring and evaluation of vendors is necessary to maintain the smooth functioning of different departments. It enables to control costs, drive service excellence and mitigate risks to gain increased value from their vendor by:
- Minimizing potential business disruption
- Avoiding deal and delivery failure
- Ensuring more-sustainable multi-sourcing, while driving most value from the vendors
- Improving operational efficiencies, control costs and planning of workforce
It includes vendor identification, recruitment, monitoring, tracking and evaluating the vendors on certain KPIs like:
- Pricing: Competitive pricing (comparable to other vendors), stability (low variance), advance notice of price changes
- Quality: Compliance with purchase order, conformity to specifications, reliability (rate of product failures), durability, support, warranty
- Delivery: Time, quantity, lead time, packaging, emergency delivery, technical support
Loyalty Analytics
In today’s competitive business scenario with consumers having a multitude of options, their preferences & buying patterns have been constantly evolving. It is necessary for retailers to gain insights into changing consumer trends & accordingly tailor their offerings.
CRM analytics helps analyse consumer’s transactional and others behavioural patterns to facilitate optimal decisions regarding marketing strategies.
It helps the business to:
- Identify consumer segments based on demographic, psychographic and purchase behaviour. Design customized product offerings and marketing strategies relevant for each of these consumer segments. Track these segments over time to study how the industry is evolving.
- Closely track and maintain constant touch-point with your most profitable & loyal consumer segments. Identify any signs of attrition in advance and accordingly formulate the right retention strategy
- Formulate cross-selling and up-selling strategies by analysing product affinities & associations. Identify the consumer segments which can be targeted for the same. This helps in increasing overall revenue contribution from the same customer base.
Pricing Analysis
Pricing strategies are crafted to meet two key objectives: profit and revenue maximization. It helps in identifying the best pricing strategy for a retailer. Price optimization enables retailers evaluate cost, assortment, margin targets and promotions. It employs predictive modeling techniques for:
- Evaluating price elasticity for their private labels and deciding the optimal price points
- Identifying price gaps/thresholds to decide the optimal price points and associated discounts for different brands and SKUs while maximizing category sales
- Determining base, promotion, markdown and discount prices
Consumer & Trade Promotions
Trade promotions and consumer promotions refer to different marketing activities implemented in the store, to increase footfalls and to drive sales and profit. The most commonly implemented programs are features, in-store displays, TPRs (temporary price reductions), couponing and loyalty reward programs.
Advanced econometric modeling techniques are used to help stores refine their promotion strategies, to understand the lift generated by various promotional programs for different categories and the associated ROI. This information is then used by marketers to:
- Optimally allocate budget among different promotion vehicles—features, displays, TPRs and couponing while increasing category sales and maximizing ROI
- Optimally allocate budget for different brands as per their revenue and profit contribution
- Design programs specific to a category instead of following “one-size fits all” approach
Real-time evaluation of promotions
Marketelligent has developed an in-house proprietary tool called PRISM, for continuous monitoring and evaluation of trade and consumer promotions on a real time basis, using the test-control approach.
Identifying the control samples for each of the test group takes most of the time and effort. PRISM minimizes the time required for the same and identifies the control samples on a real time basis, based on historical sales trends and outlet demographics.
PRISM uses sales in test and control outlets, to calculate the lift factor for each or combinations of trade promotion programs. Based on the lift factor, incremental sales and ROI are calculated for each activity. The effectiveness of promotions can be compared at different levels – channels, categories, brands and markets.
Market Mix Modeling
Usually for marketing, retailers utilize radio, magazines, newspapers and outdoor for creating awareness.
Market mix modeling helps managers develop an optimal media investment strategy that provides the required sales lift and also maximises the returns on investment by media vehicle.
The model aids in:
- Establishing key relationships between sales and marketing driver inputs
- Quantifying impact of each marketing driver on sales
- Optimizing allocation spends across media vehicles to maximise sales
- Calculating saturation spends for each media vehicle based on diminishing returns
- Evaluating decay impact, if any, for each of the media vehicles (also called ad-stock)
Market Basket Analysis
Market basket analysis is done to evaluate consumers’ purchasing behaviour and to identify the different items bought together in the same shopping session. It uses store’s transactional data and is leveraged for creating cross-selling opportunities for furthering sales.
It aids retailers in:
- Product placements–Which products should be placed next to each other
- Customizing layouts, assortments and pricing, to the local demographic
- Affinity promotion–Designing more profitable and effective consumer promotions like couponing based on associated products
Support, Confidence and Lift are used to identify the combination of products consumers buy together most often.
Fraud detection & Loss prevention
Fraud and shrinkage is one of the most common challenges faced by retailers resulting in financial and consumer trust loss. It can originate with consumers, employees, or external sources. Different types of fraud include credit-card fault, fraudulent merchandise returns and shrinkage due to shoplifting, embezzlement and human error.
Predictive modeling helps in identifying unusual patterns of purchase and product movements that can help detect fraud and shrinkage. It also helps narrow down the categories and sale seasons that are most sensitive to fraudulent behaviour. The retailer can then take extra precautions to safeguard against loss among these sensitive categories and shopping periods.
Category Sales Reporting & Analysis
Constant tracking of sales and regular reporting helps the sales force analyse category sales so that they can have an action plan before the next sales cycle starts. Also, it serves as the base for formulating sales strategies.
It helps in:
- Identifying which categories, products and SKUs are selling the most in the store
- Analysing consumer preferences and buying patterns in the store
- Evaluating growth potential for product portfolio (categories, brands and SKUs)
- Planning and managing store promotions
- Evaluating the performance of the store by categories and SKUs on a regular basis
- Enabling root-cause analysis in case of sales/profit decline: help identify the epicentre and rectify the same
Workforce Analytics
Sales force, for a retailer is an equally important asset as the product that they sell. A good, experienced sales force yields higher consumer satisfaction and hence increased sales. It is therefore critical to optimize the employee recruitment, training and supervising process. Retailers can use analytics to increase productivity and can help enable an effective and sustainable retail workforce.
The advantages of work force analytics include:
- Acquisition of talent- identifying the most effective employee attributes
- Skill set mapping- placing employees in the ideal role based on their capabilities
- Talent building- recognizing employee training needs in key skills and ensuring all employees meet store standards
- Improve scheduling effectiveness- based on predictions of when and where consumers are most likely to shop, analytics can help schedule the most-productive employees appropriately
- Retention- by understanding the key risk factors that drive attrition, employers can preemptively mitigate these risks.
- Improve safety- detect the underlying causes to workplace accidents and rectify
Opening of new stores
Site selection is crucial to a retailer and identifying the ideal location to open a new store has to be a strategic decision.
Integrating census data, which provides population and income data, along with survey data, providing demographic, psychographic and competitor store data, and financial data will give the retailer a better understanding on areas with the greatest potential. With this information, a strategic model can be built, which can help determine the best sites and best strategy for that area.
This process helps retailers identify:
- The ideal location for the stores
- The type of store format that is needed in a specific instance
- Whether to remodel or not
- What merchandising approach to adopt
Tracking Overall Performance
Retailers need to get a bird’s eye view on changing business conditions and emerging trends, and growth potential based on the sales and profits earned from their stores and categories. Accordingly they can adjust plans and forecasts to meet the new challenges and opportunities.
This requires a close monitoring and tracking process of the sales and financial measure of the overall market and then correlating it with the individual store performance.
It helps retailers:
- Analyse market trends and buying patterns in the retail industry and identify the gaps and opportunities
- Evaluate and benchmark store performance on key metrics like traffic counts, conversion rate, sales per square feet and sales per employee
- Track sales activity for all outlets by region/sub-region/category
- Identify profitable categories in various regions
Store Clustering
Retailers need to customize their product and service offering to meet the taste and preferences to diverse cultural and demographic consumer segments. Implementing strategies at an outlet level will be operationally difficult to manage, while an overall promotional campaign and strategy for all outlets, despite being operationally more feasible will not be able to meet localized consumer needs. To counter this issue, retailers need to identify stores that exhibit similar demographics, locational proximity, personal income and shopping behaviours of local consumers and device a localized approach to run their marketing activities.
Cluster analysis uses loyalty card transaction data and survey data to identify similar stores that form a cluster based on shopper demographic data and their shopping patterns. The retailer is then able to tailor specific promotional campaigns, assortment, planogramming, pricing and promotion strategies, store formats, layouts for servicing each of the identified clusters. This garners the retailer better returns on their strategies since it is more focused to shopper needs and increases consumer satisfaction due to the “personalized” approach.
Key Value Item Analysis
A few SKUs have a disproportionate impact on consumer price-value perception and can cause consumers to switch stores when those SKUs are not priced appropriately. These price sensitive items are known as Key
Value Items, or KVIs. A retailer can use this knowledge to have a significant control over the items’ perceived price image and thus regulate the store’s image by carefully fixing the everyday pricing and the promotional pricing.
Key Value Item Analysis blends behavioral data (sales, household penetration, purchase frequency) and attitudinal data (consumer awareness of product, accurate price recall, price differential across similar retailers). The KVIs are identified across categories based on revenue coverage, price sensitivity, sales volume, and the role and prevalence of the item in the market basket.
By managing true KVIs through aggressive pricing, promotions, wide range availability and correct placement, retailers will be able to:
- Influence consumers’ overall perception of the store
- Drive sales and footfalls
- Gain market share
Source: Marketelligent