 A credit scoring model is a statistical tool widely used by lenders to assess the creditworthiness of their potential and existing customers. The basic idea behind this model is that various demographic attributes and past repayment behavior of an individual can be utilized to predict hers or his probability of default.
1. Data
For demonstration purposes, we will be using the data set that contains characteristics and delinquency information for 5,960 home equity loans (source: B. Baesens, D. Roesch, H. Scheule, Credit Risk Analytics: Measurement Techniques, Applications and Examples in SAS, Wiley, 2016). The data set variables are:

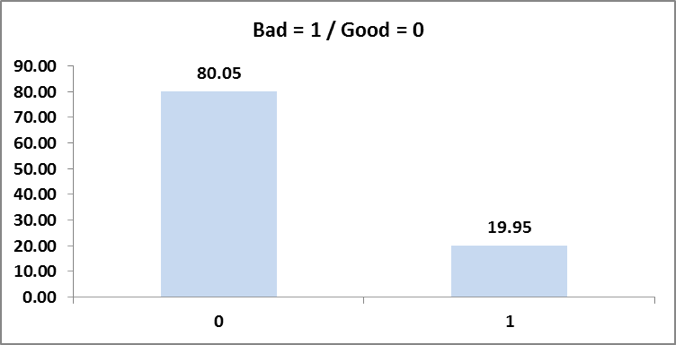
The binary variable BAD will be the target variable in our credit scoring model, while other variables will be used as predictors. There are 4,771 observations (80.05%) where bad is 0 and 1,189 observations (19.95%) where bad is 1.
2. Categorical variables
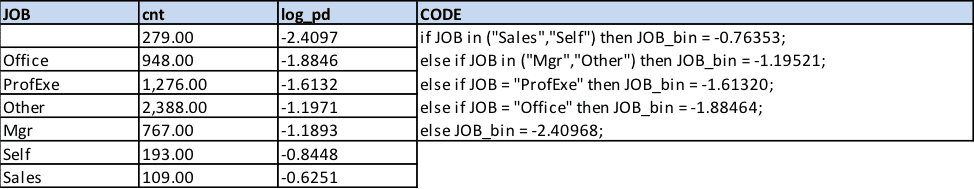
For the categorical variable, the log odds ratio of the bad is calculated for each of the values of the variable. The values for which the log odds ratio is very close or the counts is insignificant are clubbed together. The values are then replaced by the log odds ratio.
2.1. Reason
The reason variable is collapsed into 2 bins. The DebtCon and Missing have log odds ratio very close to each other.

2.2. Job
The job variable is collapsed into 5 bins. Missing is treated as a separate bin.
2.3. Derog
The derog variable is collapsed into 4 bins. The count observations for derog values more than 2 is insignificant, hence these are clubbed together.

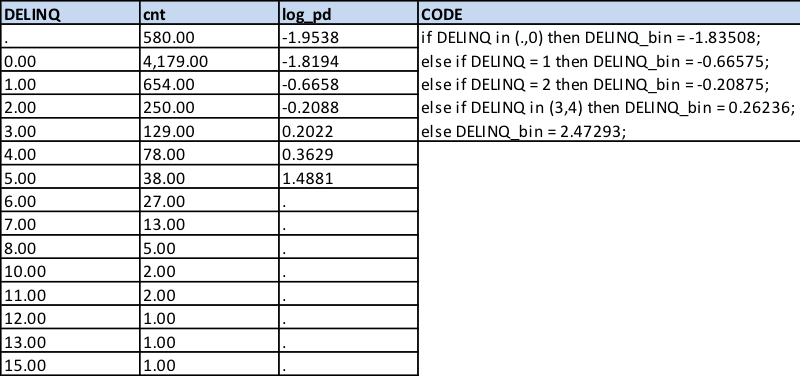
2.4. Delinq
The delinq variable is collapsed into 5 bins. The count observations for delinq values more than 4 is insignificant, hence these are clubbed together.
2.5. Ninq
The ninq variable is collapsed into 5 bins. The count observations for ninq values more than 4 is insignificant, hence these are clubbed together.

3. Numerical variables
The numerical variable are rank binned into 12 equal bins (if the values are missing then we have 13 bins with -1 indicating missing bin). Two approaches are followed to handle numerical variables:
- Treating as categorical: The bins for which the log odds ratio is very close or the counts is insignificant are clubbed together. The bins are then replaced by the log odds ratio. This process is followed for numerical variables where transformations will not linearize the variable.
- Treating as numerical: The variable is linearized and the transformed variable is used in the model.
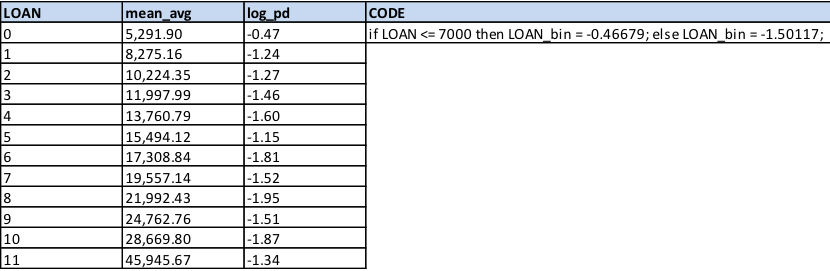
3.1. Loan
The loan variable is collapsed into 2 bins. The loan variable <= 7000 is treated as first bin and loan variable > 7000 is treated as second bin.
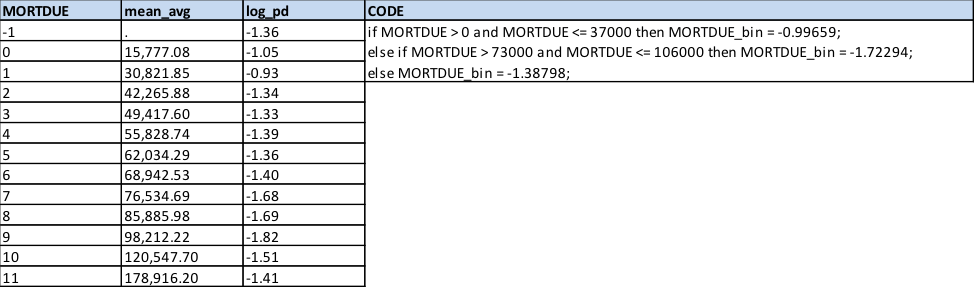
3.2. Mortdue
The mortdue variable is collapsed into 3 bins.
- First bin: The value <= 37000 is treated as first bin
- Second bin: The value > 73000 and value <= 106000 is treated as second bin
- Third bin: Rest of the values (including the missing values) are clubbed as third bin
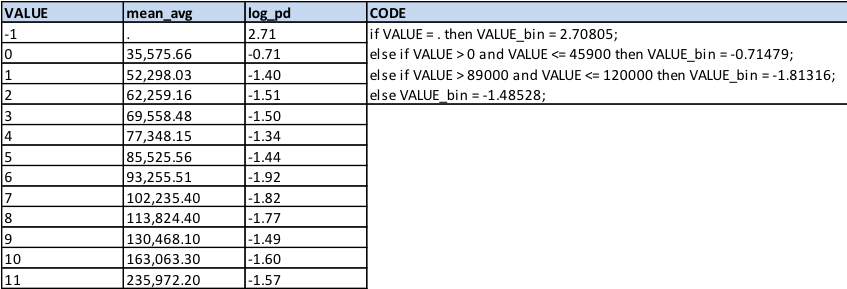
3.3. Value
The value variable is collapsed into 4 bins. Missing is treated as a separate bin.
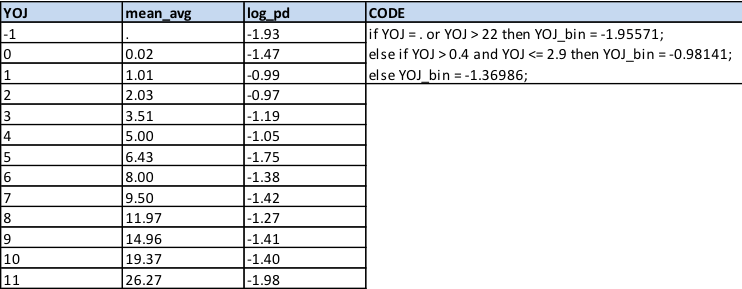
3.4. Yoj
The value variable is collapsed into 3 bins.
- First bin: The value is Missing or value > 22 is treated as first bin
- Second bin: The value > 0.4 and value <= 2.9 is treated as second bin
- Third bin: Rest of the values are clubbed as third bin
3.5. Clage
The clage variable is linearized using a quadratic equation.
- if CLAGE is MISSING then CLAGE = 0.14
- Transformation = (15.49*CLAGE*CLAGE) – (12.06*CLAGE) + 0.0789

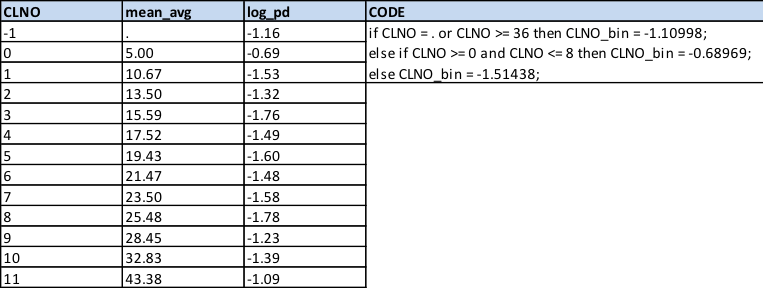
3.6. Clno
The clno variable is collapsed into 3 bins.
- First bin: The value is Missing or value >= 36 is treated as first bin
- Second bin: The value >= 0 and value <= 8 is treated as second bin
- Third bin: Rest of the values are clubbed as third bin
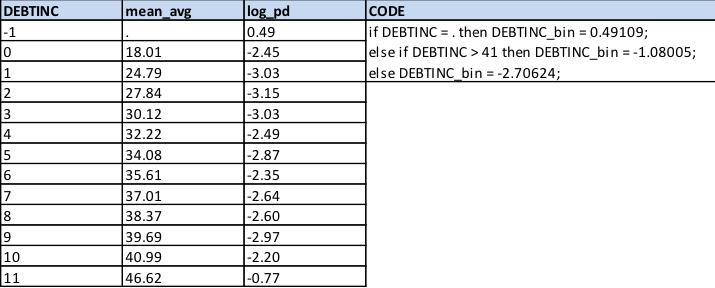
3.7. Debtinc
The debtinc variable is collapsed into 3 bins. Missing is treated as a separate bin.
4. Model
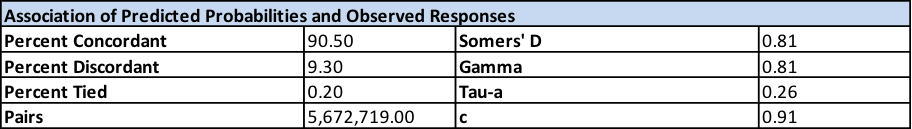
- Percent Concordant: A pair of observations with different observed responses is said to be concordant if the observation with the lower ordered response value (bad = 0) has a lower predicted mean score than the observation with the higher ordered response value (bad = 1)
- Percent Discordant: If the observation with the lower ordered response value has a higher predicted mean score than the observation with the higher ordered response value, then the pair is discordant.
- Percent Tied: If a pair of observations with different responses is neither concordant nor discordant, it is a tie.
- Pairs: This is the total number of distinct pairs in which one case has an observed outcome different from the other member of the pair.
- Somers’ D: It is used to determine the strength and direction of relation between pairs of variables. Its values range from -1.0 (all pairs disagree) to 1.0 (all pairs agree).
- C: c is equivalent to the well-known measure ROC, c ranges from 0.5 to 1, where 0.5 corresponds to the model randomly predicting the response, and a 1 corresponds to the model perfectly discriminating the response.
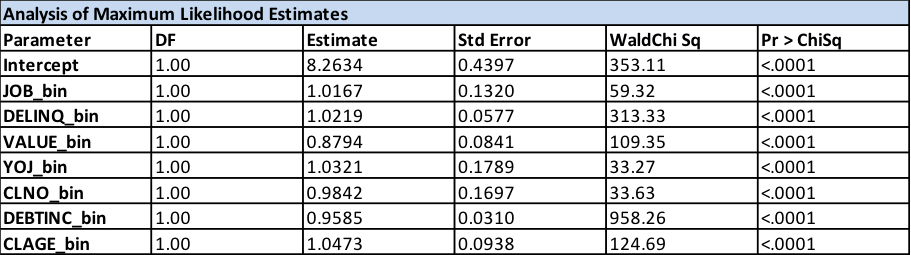
- Parameter: Underneath are the predictor variables in the model and the intercept.
- DF: This column gives the degrees of freedom corresponding to the Parameter. Each Parameter estimated in the model requires one DF and defines the Chi-Square distribution to test whether the individual regression coefficient is zero, given the other variables are in the model.
- Estimate: These are the binary logit regression estimates for the Parameters in the model. The logistic regression model models the log odds of a positive response (probability modeled is bad=1) as a linear combination the predictor variables. It should be noted here that the estimates are very close to 1 (other than the intercept). It is because we have used the binned / transformed variables in the final model.
- Standard Error: These are the standard errors of the individual regression coefficients. They are used in both the 95% Wald Confidence Limits, superscript w, and the Chi-Square test statistic, superscript t.
- Chi-Square and Pr > ChiSq: These are the test statistics and p-values, respectively, testing the null hypothesis that an individual predictor’s regression coefficient is zero, given the other predictor variables are in the model. It should be noted here that the p-value for all the variables is close to 0.
- Number of Observations Used = 5,960
- Number of Variables = 7
Confusion matrix: 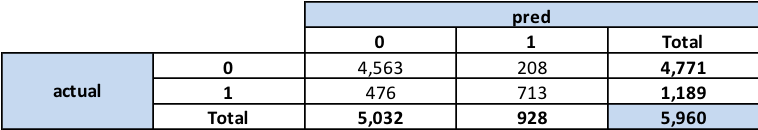
Accuracy:
Accuracy is the fraction of predictions the model got right. Formally, accuracy has the following definition:
Number of correct predictions / Total number of predictions
88.52%
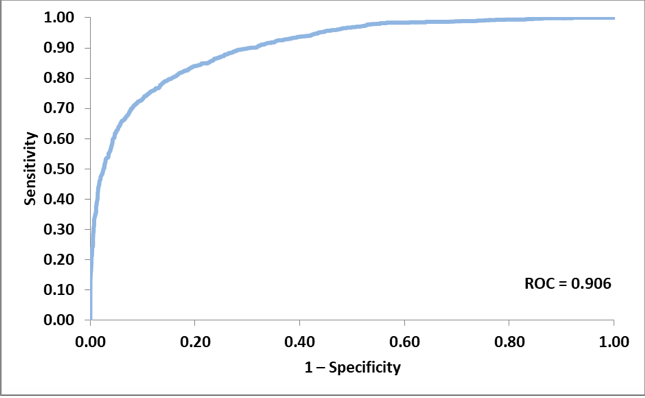
ROC:
ROC curve is a graphical plot that illustrates the diagnostic ability of a binary classifier system as its discrimination threshold is varied. The ROC curve is created by plotting the true positive rate (TPR) against the false positive rate (FPR) at various threshold settings. The true-positive rate is also known as sensitivity, recall or probability of detection in machine learning. The false-positive rate is also known as the fall-out or probability of false alarm and can be calculated as (1 − specificity).
The post A Step-by-Step Guide To Creating Credit Scoring Model From Scratch appeared first on Analytics India Magazine.