It’s been 2 years of existence for Analytics India Magazine today. The last year have been much more fruitful than the first year.
The first year was when we established ourselves as an online resource portal for analytics in India. In second year we reached out to almost the whole industry and the impact was visible.
Each year we publish a report card of how we have done in the past year, some key metrics and comparison from earlier years.
This year, we reached out to 3 times more users than a year before. The number of visits tripled as well, and the page views almost doubled.

 In terms of cities, Bangalore recorded that highest number of visitors at 24%, followed by Delhi and Mumbai at 9% each. Being an India focused portal, its not surprising that 80% of our visitors are from India.
An interesting insight – 53% of users come from Chrome as opposed to just 17% from IE.
In terms of channels, 58% of our users come through Organic Search and 17% are direct.

Facebook (both mobile and desktop) is the biggest referrer at 43% of referral traffic. Linked refers 24% of referral traffic.
Our Facebook page likes have increased from under 1000 to more than 3,000 this year.

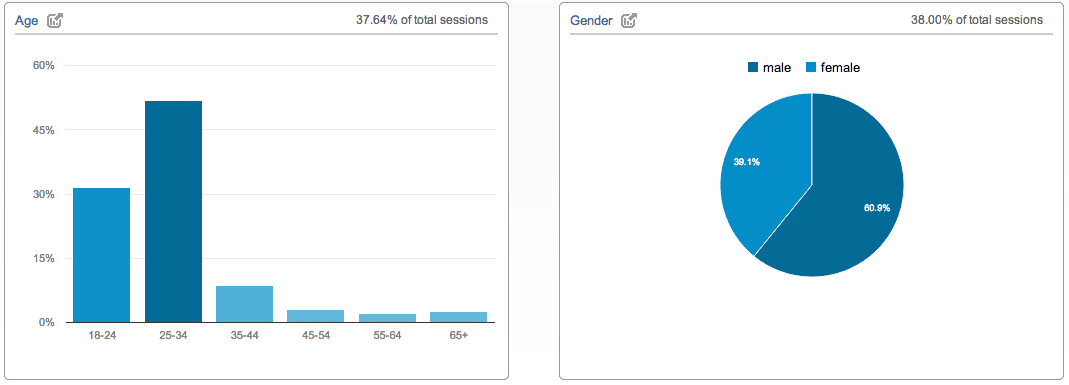
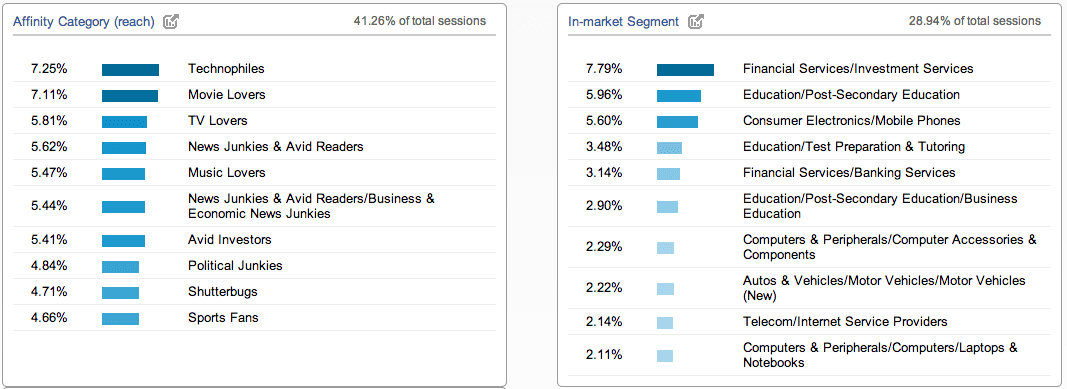
Other Metrics