Image may be NSFW.
Clik here to view.
Measuring the progress and advancements in AI over the year is a hard task. A Stanford university led group of scientists and journalists have come up with an index. The initiative has an ambitious mission of tracking and measuring progress in AI. In 2017, the team released a comprehensive report that aggregates diverse set of data, analyses it and makes sense of the data. The team has since also led the discussion about what does the data mean for technology and society.
Focus on key parameters
The AI index aggregates data that exist freely on the web, and make sense from many sources of data series. The report captures some key metrics. Volume of activity metrics capture the “how much” aspects of the field, like AI conferences attendance and investments in AI companies. The Technical Performance metrics capture the “how good” aspects; for example, how well computers can understand images and prove mathematical theorems.
The AI Vibrancy Index, that combines trends across academia and industry to quantify the liveliness of AI as a field. Some notable areas where AI systems have made significant progress towards matching or exceeding human performance. The report also contains an Expert Forum. This is where subjective commentary from a cross-section of AI experts is gathered. This Expert Forum helps animate the story behind the data in the report and adds interpretation the report lacks.
For many years, AI research and development is taking place all around the world. Technology giants including Baidu and Google have spent somewhere between $20B to $30B on AI in 2016. Along such private investments there are also government fundings for advanced technology programs also have an impact on the progress of AI.
Volume of Activity
Publishing of Research Papers
Primary sources of data that the team is Elsevier’s Scopus database of academic publications, which has indexed almost 70 million documents (69,794,685). The number of academic papers published each year that have been indexed by the Scopus catalog in the subject area “Computer Science” and have been indexed with the key term “Artificial Intelligence”. The entire Scopus database contains over 200,000 (200,237) papers that have been indexed with the key term “Artificial Intelligence”. The Scopus database contains almost 5 million (4,868,421) papers in the subject area “Computer Science”.
Clik here to view.

The number of AI papers produced each year has increased by more than 9x since 1996. The whole trend shows that interest in Artificial Intelligence is growing because of the growing interest in Computer Science.
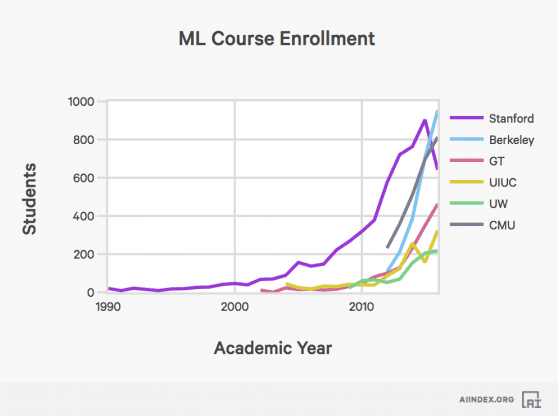
Course Enrollment
The AI index has studied the trends in enrollment is machine learning and AI course. Introductory AI class enrollment at Stanford has increased 11x since 1996. The AI index team had limited data about course enrollment in other universities.
Clik here to view.
Conference Attendance and other volume data
The AI index measures the number of attendees at a representative sample of AI conferences. The data is split into large conferences (over 1000 attendees in 2016) and small conferences (under 1000 attendees in 2016). The attendance numbers show that research focus has shifted from symbolic reasoning to machine learning and deep learning. The number of active US startups have increased over 14 times since 2000. The rise of AI companies has boosted the investment into this space, which resulted into a 6 times increase in funding since 2000. There is a sudden rise in interest in AI is also reflected in the number of jobs that AI has given rise to.
Clik here to view.
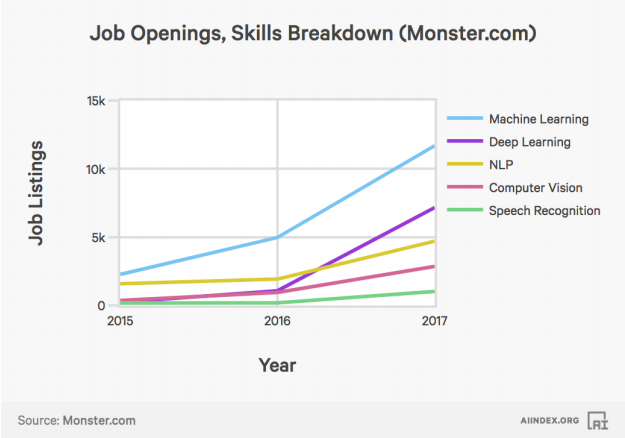
The team at AI Index studied data from two platforms: Indeed.com and Monster.com. The studies have shown that there is a 4.5 times increase in AI jobs since 2013. The fastest rise has been in the field of machine learning followed by deep learning and natural language processing.
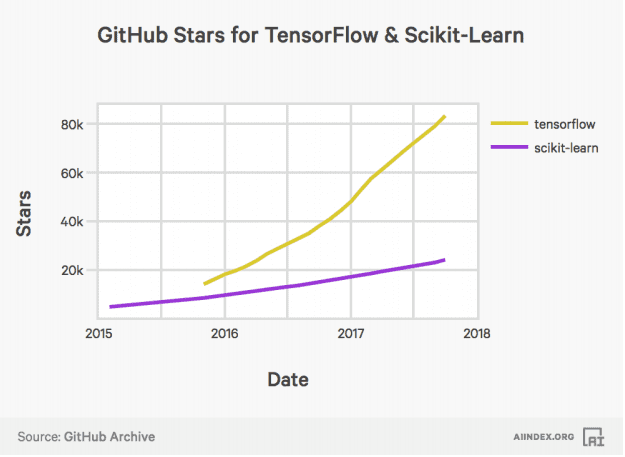
The AI Index team has also studied activity on GitHub. The activity in AI software can be studied by the number of times the TensorFlow and Scikit-Learn software packages have been starred on GitHub. TensorFlow and Scikit-Learn are two of the most popular software packages for deep learning and machine learning.
Clik here to view.
Technical Performance
The technical performance parameter measures improvement in various tasks.
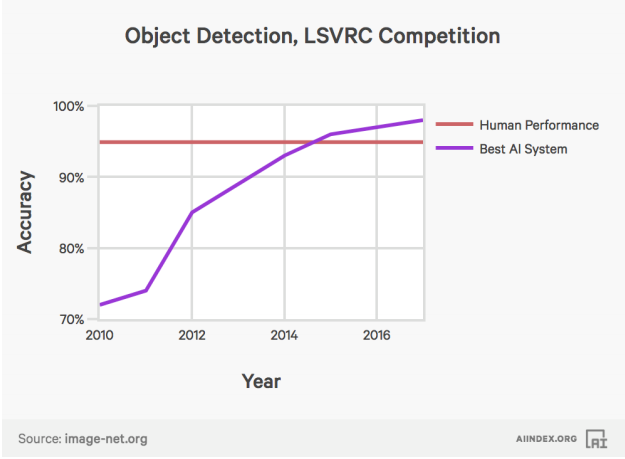
Object Detection
The performance of AI systems on the object detection task in the Large Scale Visual Recognition Challenge (LSVRC) Competition. Error rates for image labelling have fallen 2.5% from 28.5% to below 2.5% since 2010.
Clik here to view.
Visual Question Answering
The performance of AI systems on a task to give open-ended answers to questions about images. As apparent from the graph, AI systems are still far behind human potential in visual question answering.
Clik here to view.

Machine Translation
The AI Index studied the performance of AI systems on a task to translate news between English and German.
Clik here to view.
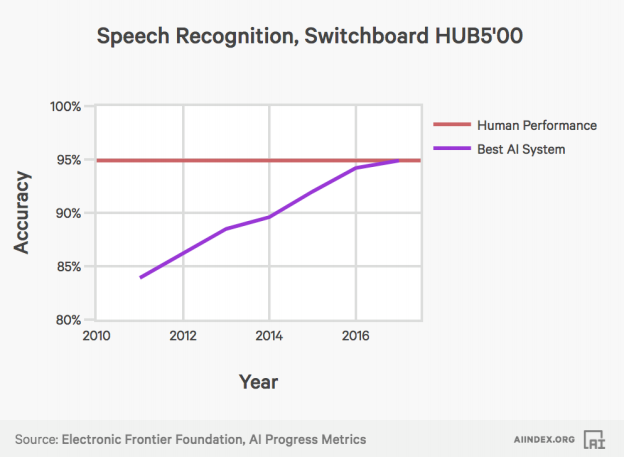
Speech Recognition
The performance of AI systems on a task to recognise speech from phone call audio.
Clik here to view.
Derivative Measures
Given the above data points, we can extract additional insights. The team at AI Index used above data points to spur the development of refined and wholly original metrics.
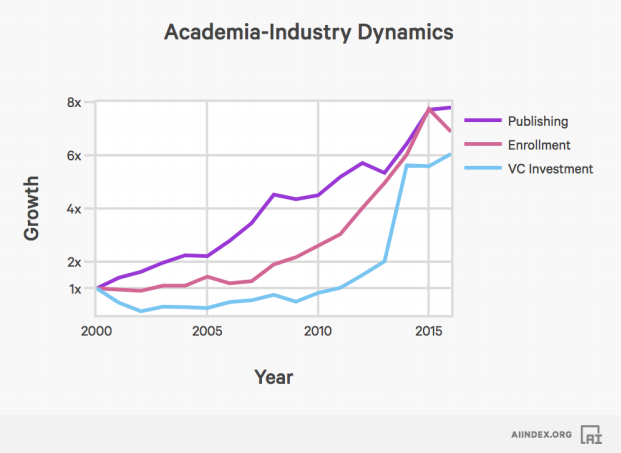
Academic Industry Dynamics
The AI Index looked at AI paper publishing, combined enrollment in introductory AI and ML courses at Stanford, investments made into the sector and other AI related activities. They looked at how these quantities grew together after normalising. The data shows that, initially, academic activity (publishing and enrollment) drove steady progress. Around 2010 investors started to take note and by 2013 became the drivers of the steep increase in total activity. Since then, academia has caught up with the exuberance of industry.
Clik here to view.
The AI Vibrancy Index
The AI Vibrancy Index aggregates the measurements from academia and industry (publishing, enrollment and VC investment). These measurements are then used to check the liveliness of the field of AI. To compute the AI Vibrancy Index, we average normalised publishing, enrollment and investment metrics over time.
Clik here to view.

AI Index hopes that the brief research sparks interest in how quantitative measures such as publishing records and others further analysed and creates discussion about what derived measures may be useful to track over time.
Towards Human Level Performance
The field of Artificial Intelligence was dreamt up by the pioneers to build machines that will be equally intelligent as humans. Hence it is natural to compare the capabilities of AI systems with that of humans. Both computers and humans are good at certain tasks. But the competence of AI systems becomes more difficult to assess when dealing with more general tasks like answering questions, playing games, and making medical diagnoses. It is very difficult for intelligent system to reach human levels of performances. This is because machine performance may degrade dramatically if the original task is modified even slightly.
Image may be NSFW.
Clik here to view.
This data accumulated by experts at AI Index can be studied by researchers outside the field to make sense of progress and advancements made in AI.
The post Stanford University Led Group Is Measuring The Progress Of Machine Intelligence. See What They Found appeared first on Analytics India Magazine.